


Gold, Crude Oil and SP500 Technical Trading Patterns
Commodities / Gold and Silver 2010 Jul 19, 2010 - 02:49 AM GMTBy: Chris_Vermeulen

 It was an interesting options expiration week for equities that’s for sure. We saw some very choppy price action with large waves of buying and selling as the bulls and bears fought for control.
Both Gold and Oil closed lower for the week which is not a good sign considering the US Dollar dropped like a rock along with them.
Below are a few of my charts
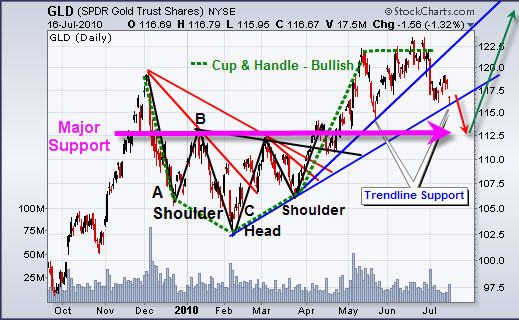
GLD – Gold ETF Price Action
Gold continues to pull back from the June highs. It looks as though it could form an ABC retrace pattern if the July 7th low is broken. If $1085 is broken we should see gold drop to $1065-75 level. On the GLD etf that would be around the $112.50 - $113.50 level. That should shake out the majority of weak positions and start to rally towards the $1250/60 level.
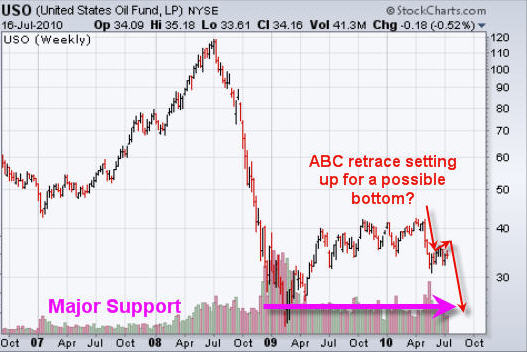
Crude Oil – USO Oil Fund
This is a weekly chart of oil which clearly shows how selling volume has risen and the trend since 2009 has gone up, sideways and is now heading back down. The bear flag forming on this weekly chart looks about ready for another leg down. Once that occurs we could see a test of the 2009 lows.
Using some inter-market analysis crude oil tends to move in the opposite direction of the US Dollar. From a quick glance at the dollar chart is looks about ready to bounce which will send oil sharply lower. It will be interesting to see how this unfolds over the next 2-3 weeks.
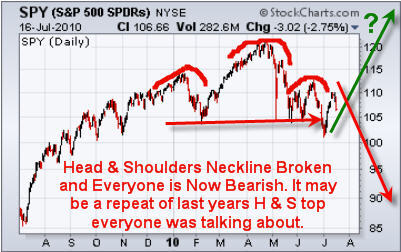
SP500 – SPY Index Fund
Friday we saw some the SP500 sell off on heavy volume after testing its 50 and 200 day moving averages which are key levels for trading and investors to take profits or add to their short positions in hope for another multi day sell off.
That being said, there is still a good change of higher prices and for all we know this could be the start of another multi month rally. While I am more inclined for us to play the down side this week I will not have a problem taking a long position if we start to see the market internals and breadth improve alone with bullish price action. I monitor the 60, 30 and 10 minute charts which allow me to get a feel for the overall short term trend and strength.
Weekend Trading Conclusion:
Overall it looks like we could have a couple more days of weakness for stocks and commodities. The US Dollar is very much oversold and as of this writing it looks like its starting a small bounce. A rising dollar tends to put downward pressure on gold and oil along with the large multi national companies.
Equities sold off Friday with a slow grind down from 9:30 -4pm never putting in any type of bounce when looking at the 60 minute chart. The SP500 and other indexes are way over sold after Friday and I am expecting some follow through Monday as investors review the charts over the weekend and see what happened on Friday. That should cause another wave of selling in the morning as traders panic out of positions.
It’s going to be an exciting week for sure!
If you would like to receive my trading alerts and education checkout my service at www.FuturesTradingSignals.com or my swing trading service at http://www.TheGoldAndOilGuy.com
By Chris Vermeulen
Chris@TheGoldAndOilGuy.com
Please visit my website for more information. http://www.TheGoldAndOilGuy.com
Chris Vermeulen is Founder of the popular trading site TheGoldAndOilGuy.com. There he shares his highly successful, low-risk trading method. For 6 years Chris has been a leader in teaching others to skillfully trade in gold, oil, and silver in both bull and bear markets. Subscribers to his service depend on Chris' uniquely consistent investment opportunities that carry exceptionally low risk and high return.
This article is intended solely for information purposes. The opinions are those of the author only. Please conduct further research and consult your financial advisor before making any investment/trading decision. No responsibility can be accepted for losses that may result as a consequence of trading on the basis of this analysis.
Chris Vermeulen Archive |
© 2005-2022 http://www.MarketOracle.co.uk - The Market Oracle is a FREE Daily Financial Markets Analysis & Forecasting online publication.