


Stocks Retreat, Gold Breaks Wedge Formation and Dollar Preps for Massive Rally
Stock-Markets / Financial Markets 2010 Jul 17, 2010 - 02:51 PM GMT
 FDIC Friday back on the job. - The FDIC Failed Bank List announStocks Retreat, Gold Breaks Wedge Formation and Dollar Preps for Massive Rallyced six new bank closures this week. FDIC employees appear to be back on the job. I wonder how quickly the FDIC runs out of money? My count suggests 91 failed banks so far in 2010.
Stocks Tumble as Banks, GE Trail Revenue Estimates
(Bloomberg) -- U.S. stocks slid, wiping out a weekly advance, as revenue at Bank of America Corp., Citigroup Inc. and General Electric Co. missed analyst estimates and a gauge of consumer confidence slid to the lowest in a year.The Standard & Poor’s 500 Index dropped 2.9 percent to 1,064.88 at 4 p.m. in New York, the biggest drop this month. It fell 1.2 percent this week, erasing its gain after the Thomson Reuters/University of Michigan index of consumer sentiment fell more than economists estimated. The Dow Jones Industrial Average lost 261.41 points, or 2.5 percent, to 10,097.90 today.
ECRI Plunges At 9.8% Rate, Double Dip Recession Virtually Assured
(ZeroHedge) The ECRI Leading Economic Index just dropped to a fresh reading of 120.6 (flat from a previously revised 121.5 as the Columbia profs scramble to create at least a neutral inflection point): this is now a -9.8 drop, and based on empirical evidence presented previously by David Rosenberg, and also confirming all the macro economic data seen in the past two months, virtually assures that the US economy is now fully in a double dip recession scenario.
The VIX rises back above its 13-week moving average.
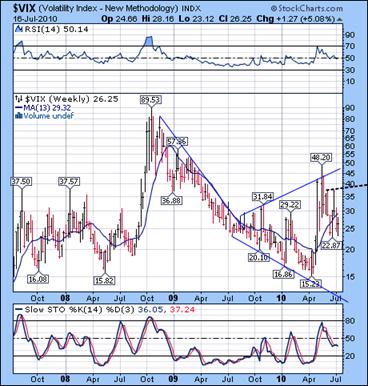 --The VIX started its climb back to its 13-week moving average at 29.32 in a deep right shoulder of an inverted Head & Shoulders pattern. The next target to overcome possibly this week is the neckline at 38.00. Its minimum target appears to be 53-55.00 and has the probability of being achieved this week as well.
The NYSE (weekly) Hi-Lo index fallen back to 32, and momentum indicators are still negative. The percentage of stocks selling above their 50-day moving average dropped to 32.40 this week, declining back towards negative territory (under 30).
SPX started to give back gains this week.
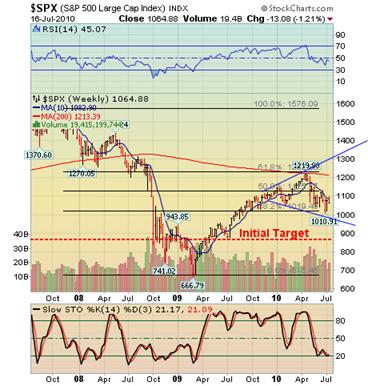 -- SPX gave up the gains of the past week…and then some as its reversal took hold on its pivot day. The minimum target for this decline appears to be 869, the July 2009 low.
This target also agrees with the initial Orthodox Broadening Top target. But there is a potentially deeper low below 800.00 that may be achieved this week, as a direct result of the extension of this rally.
The customary ramp job to get shorts to cover at the end of Friday’s trading session didn’t happen. There is always a chance of a potential “gift” of liquidity on Monday morning, but preliminary information brings that into question. There may just be too much work to be done on the downside.
The NDX did something that is rare.
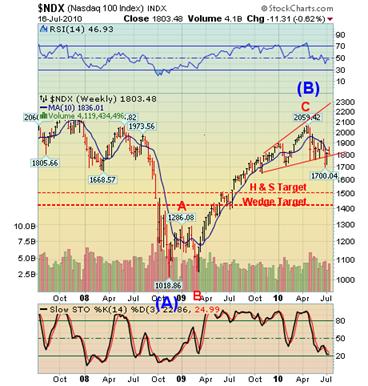 --The NDX is now resting on the trendline/neckline of a Broadening Wedge formation that also acts as a Head & Shoulders top. This week the NDX probed back inside the Broadening Formation/Head & Shoulders Neckline, which is rare (probability less than 7%).
The interesting case presented by the NDX is there are two potential targets. Since the Head and Shoulders is a part (or byproduct) of the wedge, I give the Wedge precedence. The July low is at 1395, which leads me to speculate whether this wave may extend to that level. The entire decline may happen over the next 6-7 trading days.
Gold appears to have broken its wedge formation.
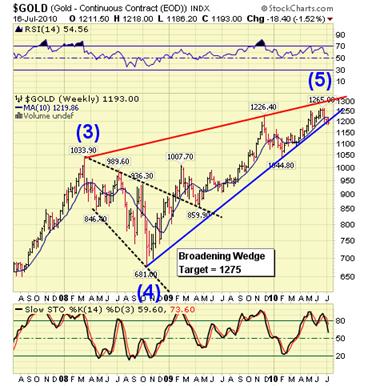 -- Gold fought to overcome its 10-week moving average and failed, taking out its 21-month trendline. I have no downside target for gold, but wedge formations are known to be totally retraced. The realization that the trend is no longer friendly is starting to grow, but the broken trendline is not yet visible to all.
Stochastics and RSI confirm that the decline has a way to go.
$WTIC is hovering at its 13-week moving average.
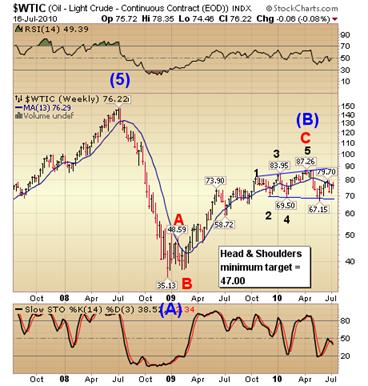 --The running correction in $WTIC appears to have been played out this week. The inability to go higher and the “failed” correction suggest that the next move will be the crossing of the Head & Shoulders neckline, which confirms the analysis below.
Using the lower B. T. trendline as a neckline of a complex Head & Shoulders pattern, we can derive a target of 47.00. Elliott Wave analysis also suggests a decline to 47.00. There seems to be a lot of confirmation for a very deep decline straight ahead.
The Bank Index has also retested its moving average.
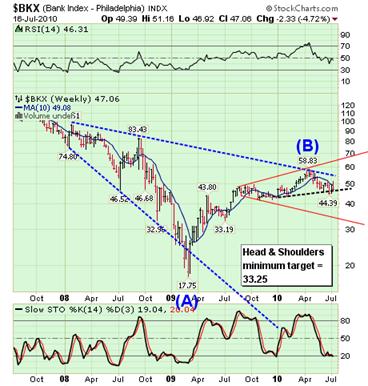 --The $BKX has also declined to the neckline of a Head & Shoulders pattern at 46.04 after completing an expanded flat correction. The final breach of the neckline gives it a potential minimum target at 33.25, near its Orthodox Broadening Top lower red trendline. Notice how close this target is to the July 2009 low.
It appears that once the Orthodox Broadening Top is violated, it may set up for an extension of the decline to the mid-20s before this impulsive decline is over.
The Shanghai Index has a second week above its low.
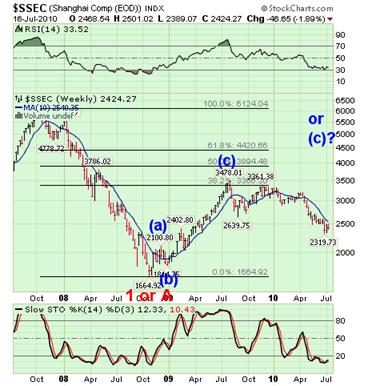 --The question is, has the Shanghai Index made an important cyclical low, allowing a rally, or will it follow the other equities markets? Next week will tell, since a new low may condemn $SSEC to join the rest of the world’s equity markets.
If it continues to decline alongside our markets, so be it. July 1 turned out to be the next “ideal landing place” for a seasonal low in the Shanghai index, where it began a reversal. If it can break its 10-week moving average to the upside, we should not ignore it. It might just give us a 4-5 month rally.
$USB on pivot and at Fibonacci resistance.
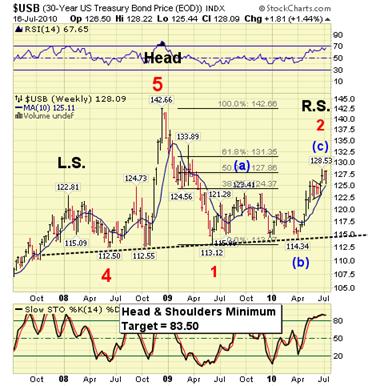 -- $USB appears to be making a reversal pattern near its Fibonacci 50% retracement. Bonds got their spike (up) reversal on Tuesday, one day after the pivot date.
Should the flight to safety in bonds continue on Monday, we may see a rally to the 61.8% retracement in the coming week. But there is an equal or greater probability of a failure in the bond market as well. The next pivot falls on Monday, where we may get our answer.
$USD may be preparing for a massive rally.
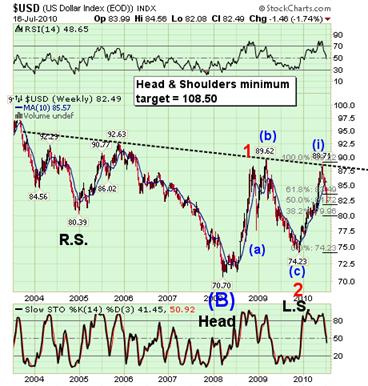 -- The $USD may have pivoted on Friday at the 50% Fibonacci retracement. We now look for the dollar to rally to the neckline of its massive Head and Shoulders pattern at the 88.71 high. The 7-year $USD chart shows an inverse Head & Shoulders pattern with a potential target of 108.50. I appears that the dollar had a different time and price target than I suggested a week ago.
I hope you all have a wonderful weekend!
Regards,
Tony
Traders alert: The Practical Investor is currently offering the daily Inner Circle Newsletter to new subscribers. Contact us at tpi@thepracticalinvestor.com for a free sample newsletter and subscription information.
Our Investment Advisor Registration is on the Web
We are in the process of updating our website at www.thepracticalinvestor.com to have more information on our services. Log on and click on Advisor Registration to get more details.
If you are a client or wish to become one, please make an appointment to discuss our investment strategies by calling Connie or Tony at (517) 699-1554, ext 10 or 11. Or e-mail us at tpi@thepracticalinvestor.com .
Anthony M. Cherniawski, President and CIO http://www.thepracticalinvestor.com
As a State Registered Investment Advisor, The Practical Investor (TPI) manages private client investment portfolios using a proprietary investment strategy created by Chief Investment Officer Tony Cherniawski. Throughout 2000-01, when many investors felt the pain of double digit market losses, TPI successfully navigated the choppy investment waters, creating a profit for our private investment clients. With a focus on preserving assets and capitalizing on opportunities, TPI clients benefited greatly from the TPI strategies, allowing them to stay on track with their life goals
Disclaimer: The content in this article is written for educational and informational purposes only. There is no offer or recommendation to buy or sell any security and no information contained here should be interpreted or construed as investment advice. Do you own due diligence as the information in this article is the opinion of Anthony M. Cherniawski and subject to change without notice.
Anthony M. Cherniawski Archive |
© 2005-2022 http://www.MarketOracle.co.uk - The Market Oracle is a FREE Daily Financial Markets Analysis & Forecasting online publication.