


The Oil Price, Where is the Next Buying Opportunity?
Commodities / Crude Oil Jul 13, 2010 - 01:38 PM GMTBy: Keith_Schaefer

 Brian Hoffman writes: About six months ago I wrote that the technical outlook for oil prices indicated oil prices may drop in the event of a downward breakout from the rising wedge that had formed in the price chart for light crude oil, or that prices should find support at US$85 per barrel if an upward breakout were to occur from that price level. A downward breakout occurred and we are now looking at the possibility of even lower oil prices over the next few months.
First, a refresher on wedge chart formations, which are continuation patterns such that a rising wedge is a temporary pause in a falling price trend, and a falling wedge is a temporary pause in a rising price trend. During the formation of a rising wedge the selling pressure on prices has started to overwhelm the buying pressure resulting in the slope of the top trend line (resistance) tilting towards the bottom trend line (support). If the support provided by the bottom trend line fails to hold prices and a downward breakout occurs, a sharp and significant price drop may follow.
Oil prices are currently trying to find support at US$70, and the next strong support level is at US$60, which would result in a retracement of about 50 per cent of the move from the US$32 low of early 2009 to the recent high of US$88 high. If oil prices were to drop as low as US$60 and find support at that level the stage could be set for the next rally in oil prices. On the upside, oil prices need to break through US$90 and find support at that level in order to reverse the current bearish trend.
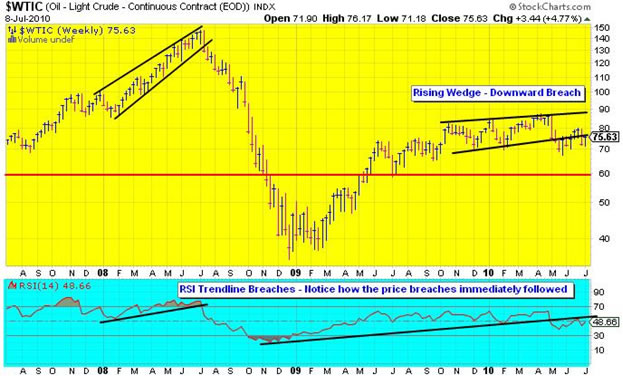
Another bearish indicator for oil is the recent breach in the uptrend in the Relative Strength Index (RSI). RSI is a momentum indicator, or oscillator, that measures the relative strength of the price of a security or, in this case, a commodity against itself. A buy signal is triggered when an upward breakout in the RSI is confirmed by an upward breakout in price. Conversely, a sell signal is triggered when a downward breakout in the RSI is confirmed by a downward breakout in price. A sell signal was triggered in May (see bottom panel in the chart above). Notice the price action for oil the last time the RSI uptrend line was breached in June 2008, which definitely confirmed the sell signal at that time.
Oil prices have several support levels below US$60, but a breach of the US$60 support level could result in prices dropping a lot lower and potentially retesting the US$32 low from late 2008. Although such a scenario is extreme, it is within the realm of possibilities given the technical weakness in broader market indexes, including the energy sector (see below), as well as the ongoing global financial deleveraging process and the austerity measures that the future holds.
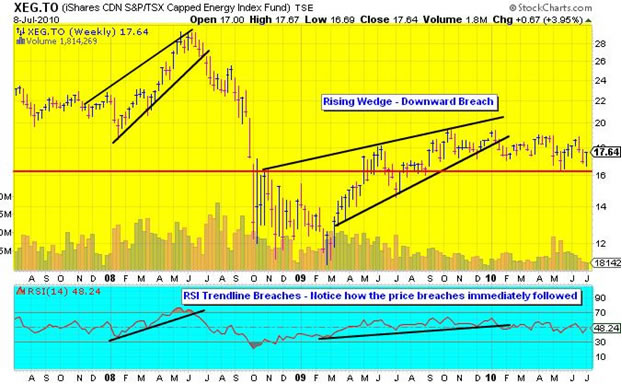
The price charts for the United States Oil Fund, LP (USO-NYSE, US$34.23), an ETF that tracks the performance of light crude oil prices, and the iShares CDN S&P/TSX Capped Energy Index Fund (XEG-TSX, $17.64), an ETF that tracks large-cap Canadian oil and gas companies, are shown below. Notice the similarities in those price charts to the chart for light crude oil prices above in terms of downward breakouts from rising wedges and the sell signals triggered from breaches of the RSI uptrend lines along with the downward price breakout confirmations (the horizontal lines in the charts below indicate near-term support levels). The noticeable differences with the XEG ETF’s price action are that the downward breakout from its rising wedge occurred a lot sooner and the price failed to exceed the January price high during the seasonally strong February to May period. With oil prices performing better than the share prices of oil companies that is a bearish indicator for the XEG ETF.
Conclusion: Oil prices may drop to US$60 over the next few months if they fail to find support at US$70, which will impact oil-related investments. Watch support levels on positions of oil sector investments as the share prices of some oil companies have already breached their support levels. If oil prices drop to US$60 then wait for support to firmly establish at that level before taking positions in oil-related investments. This scenario may take until October to play out, which may present an ideal entry point in November.
This Technological Revolution Allowed Me to
Earn Short-term Oil & Gas Profits of 146.1%
New technologies – at this very moment – are revolutionizing the oil and gas exploration industries.
But only a handful of people truly understand how the technology works.
This remarkable scenario creates an enormous, short-term profit opportunity each time a company employs these new technologies successfully.
I’d like to show you exactly how this scenario is unfolding…and how you can pounce on the next triple-digit oil & gas blockbuster.
Click here to read my full report that explains how to get started.
Brian Hoffman, CA, CPA, is an affiliate of the Market Technicians Assoc. and a member of the Canadian Society of Technical Analysts (E-mail: bk.hoffman@rogers.com)
About Oil & Gas Investments Bulletin
Keith Schaefer, Editor and Publisher of Oil & Gas Investments Bulletin, writes on oil and natural gas markets - and stocks - in a simple, easy to read manner. He uses research reports and trade magazines, interviews industry experts and executives to identify trends in the oil and gas industry - and writes about them in a public blog. He then finds investments that make money based on that information. Company information is shared only with Oil & Gas Investments subscribers in the Bulletin - they see what he’s buying, when he buys it, and why.
The Oil & Gas Investments Bulletin subscription service finds, researches and profiles growing oil and gas companies. The Oil and Gas Investments Bulletin is a completely independent service, written to build subscriber loyalty. Companies do not pay in any way to be profiled. For more information about the Bulletin or to subscribe, please visit: www.oilandgas-investments.com.
Legal Disclaimer: Under no circumstances should any Oil and Gas Investments Bulletin material be construed as an offering of securities or investment advice. Readers should consult with his/her professional investment advisor regarding investments in securities referred to herein. It is our opinion that junior public oil and gas companies should be evaluated as speculative investments. The companies on which we focus are typically smaller, early stage, oil and gas producers. Such companies by nature carry a high level of risk. Keith Schaefer is not a registered investment dealer or advisor. No statement or expression of opinion, or any other matter herein, directly or indirectly, is an offer to buy or sell the securities mentioned, or the giving of investment advice. Oil and Gas Investments is a commercial enterprise whose revenue is solely derived from subscription fees. It has been designed to serve as a research portal for subscribers, who must rely on themselves or their investment advisors in determining the suitability of any investment decisions they wish to make. Keith Schaefer does not receive fees directly or indirectly in connection with any comments or opinions expressed in his reports. He bases his investment decisions based on his research, and will state in each instance the shares held by him in each company. The copyright in all material on this site is held or used by permission by us. The contents of this site are provided for informational purposes only and may not, in any form or by any means, be copied or reproduced, summarized, distributed, modified, transmitted, revised or commercially exploited without our prior written permission.
© 2010, Oil & Gas Investments Bulletin
Contact Us:nichola@oilandgas-investments.com
Customer Service: 1-877-844-8606
www.oilandgas-investments.com
© 2005-2022 http://www.MarketOracle.co.uk - The Market Oracle is a FREE Daily Financial Markets Analysis & Forecasting online publication.