


Can the Stock Market and Gold Keep Rising?
Stock-Markets / Financial Markets 2010 Jul 11, 2010 - 04:53 PM GMTBy: John_Townsend

 The stock market, we know, moves from one emotional extreme to the other. Fear to greed, back to fear then greed, and so on.
And a good stock trader should always be asking him/herself, are we at an extreme and if so, which one?
This chart is my attempt to communicate that we are at an extreme in sentiment. And it turns out that the extreme at this time is FEAR, not greed.
The lower chart is data from Investor's Intelligence and graphically measures their weekly readings of bearish investment advisors. The upper chart is the weekly SPX for the past four years.
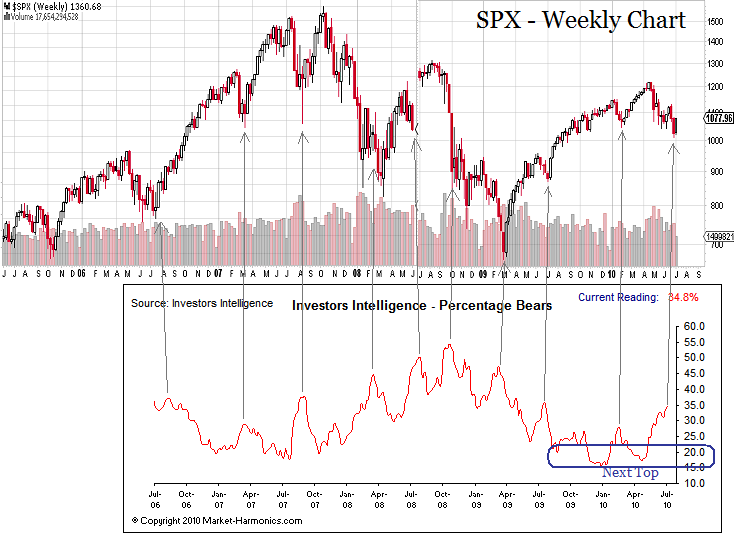
You will notice that each peak in the percentage of bearish investment advisors marks an important low in the stock market. And, we observe that from bottom to top, each cycle of emotion is not able to stretch more than about 20% in a given period of time. It would seem that human fear can be pushed just so far and then it seeks relief – no matter the perceived fundamentals of the stock market. And likewise, emotions of confidence and downright greed can only be stretched so far before the sentiment cycle bottoms and turns back up.
The current situation is that bearishness has been stretched about 20% in the past 10 weeks and should be getting close to beginning a roll over. Of course, this means that the stock market should be generally going higher over the next many weeks.
A current bears begin to throw in the towel and become buyers, the cycle progresses through its natural course. This alone is what will propel the stock market higher into the foreseeable future.
I have identified a range on the chart where we could expect the stock market to start running into trouble – the next top - and that would be when the percentage of bears finally drops back down to somewhere around 20%. As that is likely to take quite a while, this current rally could last quite a while, weeks and weeks.
Here is another chart to observe the timeless pendulum swing of human emotion. This is a chart of the Put/Call ratio of Equities from 2005 to the present.
What I have done is identify the price of the SP-500 at the major peaks and bottoms. Notice how the bottoms are always highs in the stock market. Notice how the peaks are always lows in the stock market.
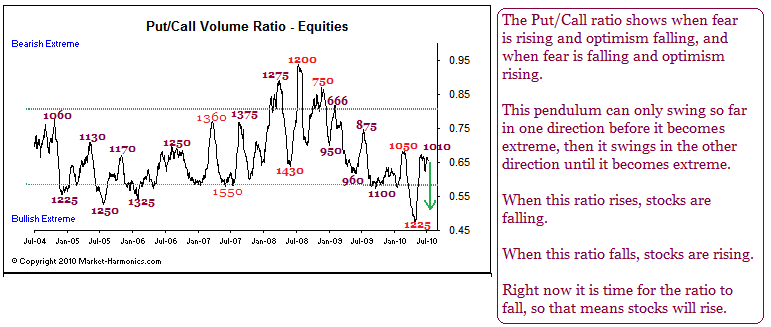
We observe that the pendulum rarely swings more than .20 in one direction or the other. At present, we have swung about that far from the previous bottom and appear to be deciding where to go next. My feeling is that the pendulum should now swing downward and thereby pull stocks upwards.
Gold is in a secular bull market and going to go much higher over time, particularly as it is still in the process of the C wave of its ABCD characteristic pattern, and should be delivering a parabolic advance in the upcoming months.
But gold has got itself in a bit of a tough situation at the moment, and I do not see how it will be able to wiggle free until it first heads south. The following chart is an hourly chart of GLD for the past 5 or 6 weeks. I use the True Strength Index (TSI) indicator to generate buy and sell decisions and the indicator is shown below the GLD price action.
On this chart I demonstrate the technique of trend line breaks to give me sell signals when the upward momentum of gold cannot be sustained. At present, it appears that gold is in the precarious position of having drained its battery over the past five sessions and looks ready to drop. There is a gap below Friday’s trade that probably needs to be filled anyway.
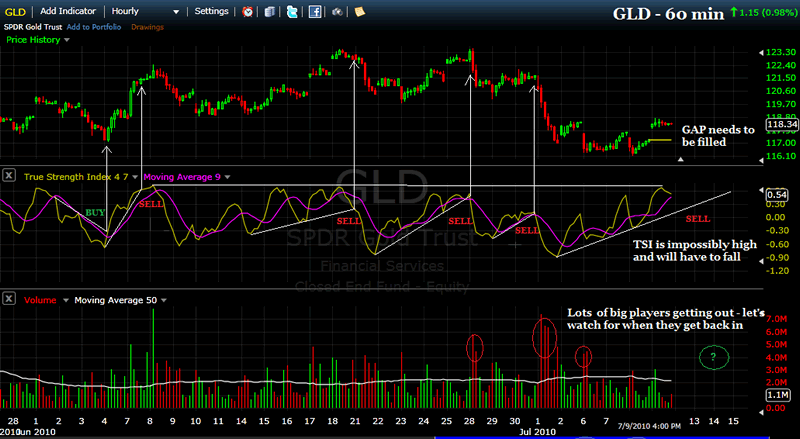
Once gold falls through that white trend line I drew using the True Strength Index (Monday or Tuesday), it will be interesting to see if the indicator then continues to fall below its ZERO level. When the TSI indicator is falling below ZERO, price is also falling and will continue to do so until the indicator reverses.
The other thing I will be interested to see is what kind of positive volume comes into GLD. So far it appears that some big volume players have taken their chips off the table and when they come back to play, that could put in a bottom for gold.
By John Townsend
At my website you will find these charts and many others with details on how you can use the True Strength Index (TSI) indicator at www.FreeStockCharts.com. There are 5 or 6 techniques for deriving buy/sell signals using the TSI and I freely make this information available for your use. If interested in learning more, please visit my site: TheTSItrader.blogspot.com or Email me at: TSITrader@gmail.com
© 2010 Copyright John Townsend - All Rights Reserved
Disclaimer: The above is a matter of opinion provided for general information purposes only and is not intended as investment advice. Information and analysis above are derived from sources and utilising methods believed to be reliable, but we cannot accept responsibility for any losses you may incur as a result of this analysis. Individuals should consult with their personal financial advisors.
© 2005-2022 http://www.MarketOracle.co.uk - The Market Oracle is a FREE Daily Financial Markets Analysis & Forecasting online publication.