Stocks Bull Market Correction or Bear Market?
News_Letter / Stock Markets 2010 Jul 10, 2010 - 06:43 PM GMTBy: NewsLetter
 The Market Oracle Newsletter
July 4th, 2010 Issue #40 Vol. 4
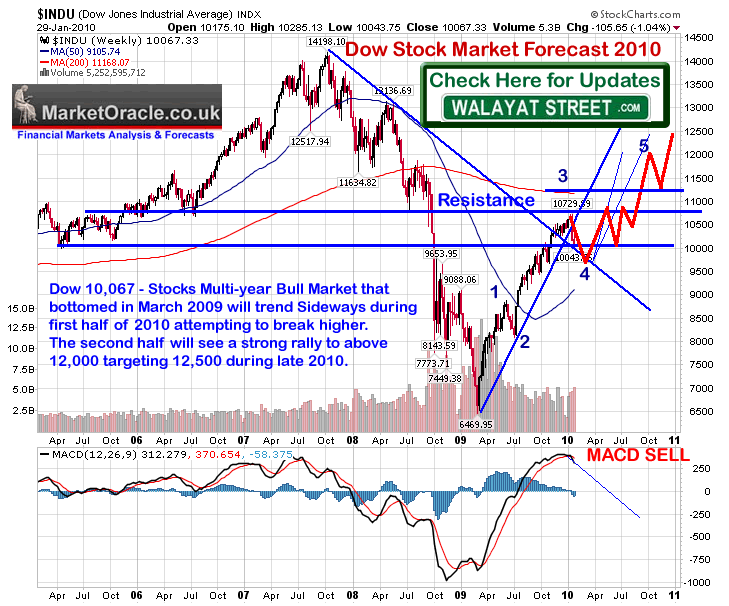
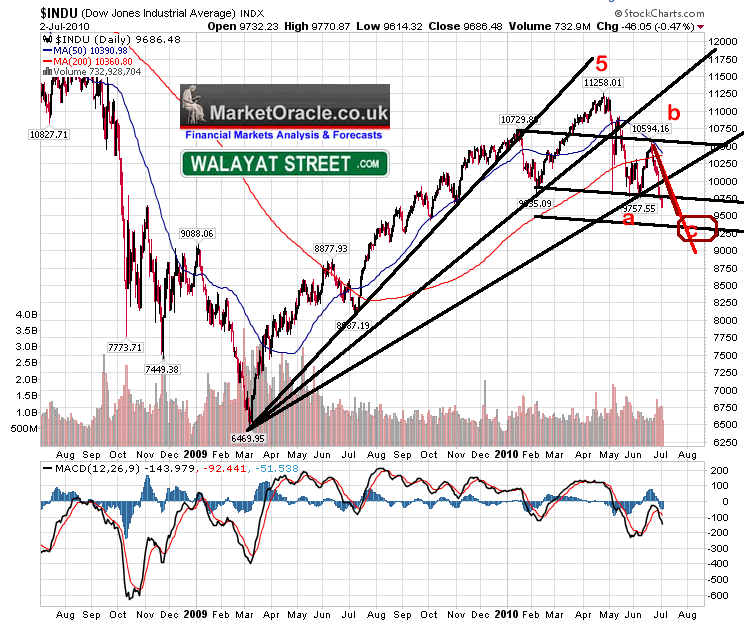
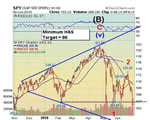
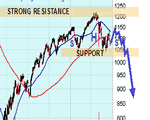
Stocks Bull Market Correction or Bear Market?Inflation Mega-Trend Ebook Direct Download Link (PDF 3.2m/b) Dear Reader My primary focus at this time remains the UK economy and housing market so as to conclude in a multi-year UK house prices trend forecast and ebook by mid August 2010. However in response to requests and price action here is an interim analysis of the stock market: Stocks Last In depth Analysis - 16 May 2010 - Stocks Bull Market Hits Eurozone Debt Crisis Brick Wall, Forecast Into July 2010 Stock Market Road Map for 2010 -02 Feb 2010 - Stocks Stealth Bull Market Trend Forecast For 2010 Dow support failed at 10,300, the stock market was sucked back towards 9,800 which broke which CHANGED the trend pattern that had been in force as of the Mid May analysis i.e. instead of an ABC into early June, the market is now saying that that was the first leg of a larger ABC pattern. The trend pattern is undoubtedly bearish, but STILL corrective, i.e. the 15% or so downtrend is correcting the preceding 70% advance off of the March 2009 lows. Elliot Wave Theory - The Elliott Wave pattern of an ABC off of the 5th peak implies a trend towards 9,100 to complete the larger corrective pattern by late July. The alternative which the bears are playing towards is that April was a B wave peak which at the very least implies Dow revisiting the March 2009 lows, at this point I give this a less than 20% probability. Yes the market has weakened, but the correction is still just that a correction. MACD - Has the opportunity to set itself up for a higher low, i.e. in line with the ABC correction scenario to show positive divergence against the trend. Price Patterns - Apparently the stock market has broken its neck as per the Head and Shoulders Pattern that signals a bear market. Yes the break below 9,800 is bearish, however one can not conclude bull or bear markets on the basis of one price pattern that turns out to be false more often then right i.e. Look at May to July 09, where we basically have the same price pattern that at the time was signaling a bear market returning to break the March lows, as media stars such as Nouriel Roubini were publically declaring virtually at the very low of the move. The current pattern equally will probably resolve higher just as the majority conclude that the bull market is over on the basis of price patterns. Remember on its own ANY single pattern or technical tool or theory is no better than a coin toss! Economic Analysis - My economic analysis whilst yet to be completed, paints a picture of economic consolidation rather then recession, i.e. economies consolidate into low growth regimes as they seek to balance deficits against stimulus measures, employing inflation (via QE) as a stealth tax to achieve this, so NO DEFLATION. Trend Analysis - The bull market's second up trendline broke in early May which signaled the start of the correction phase. Current trend is borderline within a down sloping channel, currently favouring trend within the lower channel. The market is currently below the mid channel line at 9,750. The best outcome would be for the Dow to rally above 9,750 and then hold this channel line so as to avoid a deeper low along the bottom channel line (9,300ish). On the upside its going to be tough for the dow to break above the upper channel line which should cap any rally. Averages - 50 day and 200 day are acting as resistance, and I am sure you have all heard of the death cross i.e. when the averages cross. Whilst this is bearish, it is inline for a multi-month correction that could witness several crosses during a trading range thus negating its importance. Time - Time wise as originally indicated in mid May the correction needs at least 3 months to work out the preceding 13 month rally, Mid May to Mid July is not enough, implies the market is going to continue correcting into early August i.e. within a low end trading range. Targets - A break below 9,800 targets just below Dow 9,500, then 9,250, then 9150. Conclusion - The original forecast correction to 9,800 proved too mild, we are in a more severe points correction, however trend wise and time wise we remain within a trading range that seeks to correct the preceding bull run to Mid April 2010, that's a 13 months advance that requires at least 3 months of down time that extends to late July - Mid August for a down sloping range pattern as illustrated by the below graph. The key to the trend for the next month or so is if the Dow is able to climb back above the mid channel line at 9,750. If it does then the Dow will target the upper channel at about 10,550 and remain stuck in this down sloping channel, failure to retake 9,750 targets a trend in line with the bottom channel line which would target a 9,250 low.
Bottom Line - We remain in a stocks stealth bull market and the action off of the April 2010 high is correcting the preceding 70% advance, which I expect to ultimately resolve to a new bull market highs this year. Risks to this Analysis - That April was the top and we are now in a bear market that targets new lows i.e. Dow 6470. My Strategy - I view this sell off as an opportunity to accumulate more, i.e. I did not buy any Brazil exposure when it was cheap last year so that's at the top of my list to add, though EWZ at 63.90, is still not particular cheap so I may have to bite the bullet at this price for long-run exposure. Your barely scratched the surface analyst on the amount of work needed to be completed to arrive at an accurate multi-year UK house price trend forecast. Comments and Source: http://www.marketoracle.co.uk/Article20833.html By Nadeem Walayat Copyright © 2005-10 Marketoracle.co.uk (Market Oracle Ltd). All rights reserved. Featured Analysis of the Week


 Most Popular Financial Markets Analysis of the Week :
By: Clive_Maund A great way to make yourself popular is to tell people what they want to hear, and the trick is to make yourself scarce before the wheel comes off, or at least slip quickly into the background when it does. Thus you’ll find no shortage of articles out there telling you what a great investment gold is and the countless reasons for buying it. They are “playing to the gallery” which is normal near a market peak. However, most of the evidence that we are examining points to an imminent reversal and retreat - not a bearmarket though as the bullmarket in gold is thought to have much further to run and will probably end in a spectacular parabolic blow off with prices at dizzying heights compared to today, but this is still a long way ahead of us - over a shorter time horizon we may first have to deal with a significant correction.
By: Andrew Mickey There are few sectors as volatile, risky, yet as potentially lucrative, than initial public offerings (IPOs).
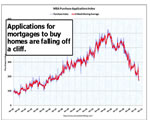
We are halfway through the year (where did the time go?) and it is time to make some predictions about the last half of the year. This week we look at what the leading indicators are telling us, size up a new indicator, drop in on banking data, and do a whole lot more.
"Advice is what we ask for when we already know the answer but wish we didn't." ~ Erica Jong The M3 money supply in the United States is contracting at an accelerating rate that now matches the average decline seen from 1929 to 1933, despite near zero interest rates and the biggest fiscal blitz in history. The M3 figures - which include broad range of bank accounts and are tracked by British and European monetarists for warning signals about the direction of the US economy a year or so in advance - began shrinking last summer. The pace has since quickened.
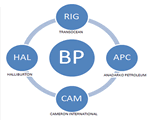
As horrific as the gulf environmental catastrophe is, an even more intractable and cataclysmic disaster may be looming. The yet unknowable costs associated with clean-up, litigation and compensation damages due to arguably the world’s worst environmental tragedy, may be in the process of triggering a credit event by British Petroleum (BP) that will be equally devastating to global over-the-counter (OTC) derivatives. The potential contagion may eventually show that Lehman Bros. and Bear Stearns were simply early warning signals of the devastation lurking and continuing to grow unchecked in the $615T OTC Derivatives market.
By: Jason_Hamlin Gold futures expire today, June 28th. If you follow the manipulation theories, it is just prior to expiration time, either in futures or options, that paper shorts increase their net short positions in order to manipulate precious metals (and stocks) downward. This allows the manipulators to profit as the contracts they sold to unwitting investors expire worthless. The sudden drop in price also provides an opportunity for the shorts to cover their positions, profiting via paying back their creditors with lower priced gold or equities.
By: Nadeem_Walayat The Chancellor of the Exchequer, George Osborne hit the reset button on the UK economy by delivering the most radical budget of the past 30 years that has sought to cut an extra £40 billion from Britains annual budget deficit by 2014-15 which is on top of ALL of Labours March 2010 budget cuts and tax rises of £73 billion that the coalition left intact. The cuts totaling a withdrawal of £113 billion from the economy will be phased in by 2015-16 and by then total about 7.5% of GDP which is a huge amount that is deemed necessary to divert Britain from its current path towards bankruptcy that Labour had put it firmly upon as a consequence of running an annual budget deficit of 12% of GDP.
By: Andrew_Butter On March 14th 2008 Nouriel Roubini’s made a prognosis about bouncing dead cats "Reflections on the latest dead cat bounce or bear market sucker's rally". I was so inspired that I conducted a very scientific experiment throwing dead cats off buildings to check how high they bounce; based on my findings I built a carefully constructed “algorithm” to prove beyond all scientific doubt that he was wrong.
You're receiving this Email because you've registered with our website. How to Subscribe Click here to register and get our FREE Newsletter To access the Newsletter archive this link Forward a Message to Someone [FORWARD] To update your preferences [PREFERENCES] How to Unsubscribe - [UNSUBSCRIBE]
The Market Oracle is a FREE Financial Markets Forecasting & Analysis Newsletter and online publication. |
||||||||||||||||||||||||||||||||||||||||||||||||||||||||||||||||||||||||||||
© 2005-2022 http://www.MarketOracle.co.uk - The Market Oracle is a FREE Daily Financial Markets Analysis & Forecasting online publication.


