


Stock Market SP-500, GLD and GDX, Down More or Now Up?
Stock-Markets / Financial Markets 2010 Jul 06, 2010 - 05:00 PM GMTBy: John_Townsend

 Its mid afternoon Tuesday and the markets are selling off – still. It seems like it will never end. Big red candles on every chart I look. The VIX, the temperature gauge of fear, is rising again and the news headlines are filled with gut wrenching uncertainties about US Municipals, foreign countries that are characterized as ticking time bombs and opinion that we are headed for another Great Depression.
With that backdrop, how about we ponder some charts and see if this market correction is likely to stay with us for infinity and beyond or if perhaps it has not only worn out its welcome, but is also close to having its flame extinguished.
Let’s begin with the SP-500 hourly chart. I made this chart online at the website www.FreeStockCharts.com. The indicator displayed below price is the True Strength Index, commonly referred to as the TSI. It is an elegantly smooth and responsive momentum indicator.
First off, we’ll note that both the SP-500 and the TSI indicator have a trend line of lower highs connected by a white line. The TSI trend line spans the entire 11 days of the SP-500 correction from 1131 to this moment.
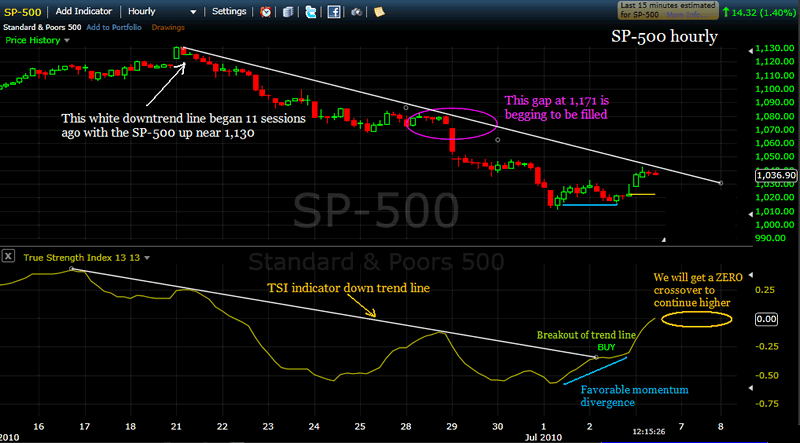
The exact midpoint of this SP-500 down leg is around 1,071 where we conveniently find an open gap that is begging to be filled. Price today rallied up to the white trend line and has since been repelled lower. It would be easy to conclude, at this moment, that the stock market will continue to fall apart except that the True Strength Index indicator is suggesting something quite different.
The white trend line of the TSI has already given a BUY signal – as it was broken to the upside when price was just 1,017. Since early Friday, the indicator of momentum has continued to rise and actually reached the ZERO level before being turned down an hour or two ago.
When the TSI indicator is rising ABOVE zero, price will absolutely be rising simultaneously. That is how the indicator was designed to work. As we are now very close to crossing the ZERO level, I take that as a bullish sign.
The other thing the True Strength Index is showing us is a favorable divergence. The indicator is making higher lows while the SP-500 price is flat. This indicates that a critical shift in momentum has occurred or is about to occur.
Next, let’s look at GLD and see if we can figure out if it is likely to continue falling. This is a 30 minute chart of GLD.
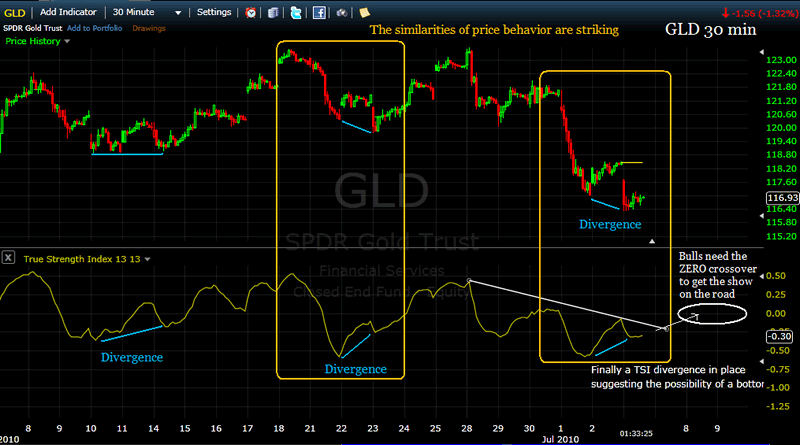
We notice that price is currently behaving in a manner curiously similar to a multi-day patch of time beginning 8 sessions ago. There appear to be two prior instances when a divergence of GLD price with respect to the True Strength Index indicator preceded a run up in price. Perhaps the current divergence in place signals a bottom, as before. The trend line of the TSI has not yet broken out to the upside, so the jury is still out on how this will be resolved. But the clues look very favorable for GLD having bottomed today.
If gold is about to bottom, or has already bottomed, one would think the miners would somehow confirm that possibility – so let’s now take a look at GDX to see what we can find.
I made this chart online at www.stockcharts.com. On first blush, I saw those big red candles and it was difficult to emotionally get excited about what I saw. Then I thought it curious that the lows across the chart seemed rather repetitive…..like maybe they were cycles, or something.
At StockCharts.com you can select ‘Annotate – Flash or Java’ and then be able to use some interesting measurement and drawing tools on the chart. I selected a tool that displays on the screen with vertical lines and you pull the indicator left and right across the screen to make the lines more or less frequent and therefore, closer or further apart. Each line is equidistant from the other – and looks like a series of blue parallel lines.
The application for this tool, of course, is to explore whether a price chart displays cyclical characteristics.
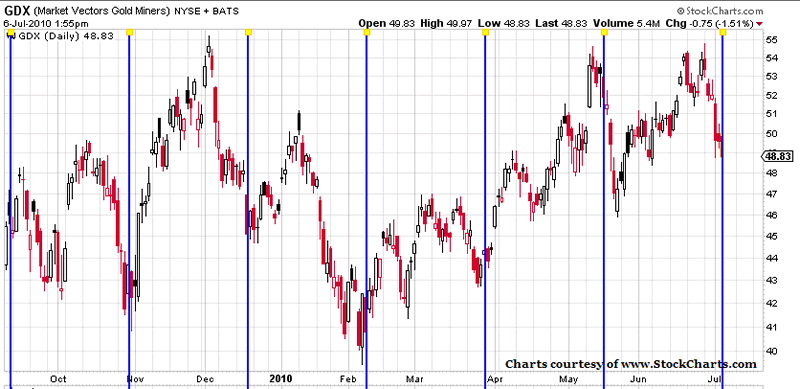
I pulled the tool across the GDX chart, creating blue parallel lines equidistant one from the other, and nearly could not believe my eyes. Plain as day, there were the cycles of GDX. Sometimes a cycle bottoms a few days early, sometimes a few days late. But after the cycle bottomed price always exploded higher. Could it be that our recent horrible red candles are occurring right on schedule and about to turn into white candles exploding higher and higher?
I invite you to visit my website at www.theTSItrader.blogspot.com. I usually offer a few posts each day on my market observations, often comment on the particular stocks I am currently trading, and try to show ways to use the True Strength Index indicator to make some sense of where the precious metals and their miners are heading. You may comment at my blog or contact me at: TSItrader@gmail.com
Thank you for reading my thoughts. Please do not hesitate to share yours with me.
John Townsendmailto:TSItrader@gmail.com
© 2010 Copyright John Townsend - All Rights Reserved
Disclaimer: The above is a matter of opinion provided for general information purposes only and is not intended as investment advice. Information and analysis above are derived from sources and utilising methods believed to be reliable, but we cannot accept responsibility for any losses you may incur as a result of this analysis. Individuals should consult with their personal financial advisors.
© 2005-2022 http://www.MarketOracle.co.uk - The Market Oracle is a FREE Daily Financial Markets Analysis & Forecasting online publication.