The Black-Art of Predicting Stock Market Dead Cat Bounces: One More for S&P 500?
Stock-Markets / Stock Markets 2010 Jun 30, 2010 - 06:03 PM GMTBy: Andrew_Butter
 On March 14th 2008 Nouriel Roubini’s made a prognosis about bouncing dead cats "Reflections on the latest dead cat bounce or bear market sucker's rally". I was so inspired that I conducted a very scientific experiment throwing dead cats off buildings to check how high they bounce; based on my findings I built a carefully constructed “algorithm” to prove beyond all scientific doubt that he was wrong.
 http://www.marketoracle.co.uk/Article9749.html
http://www.marketoracle.co.uk/Article10101.html
Regardless, Roubini has become quite famous for his timing on stock markets; so much so that some disrespectful wags recommend that whenever he says stocks are going down 20%, it’s time to buy.
http://www.marketoracle.co.uk/Article19717.html
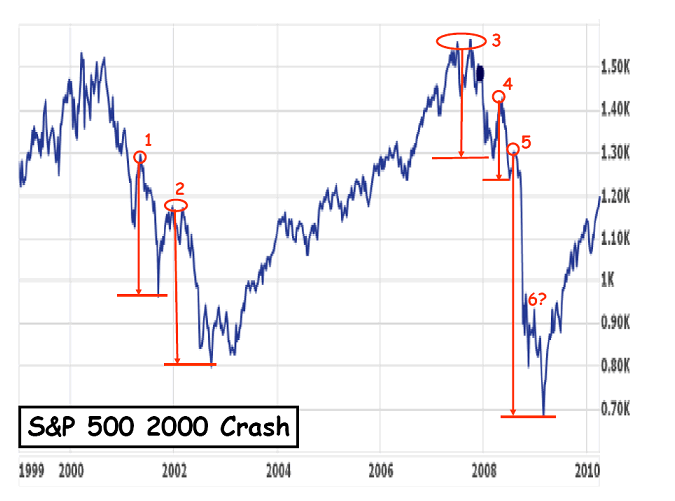
The question a few people are asking these days is whether the recent run up in the S&P 500 to 1,200 will end in tears, particularly since the “support” just got broken? Or more specifically a dead cat, where the low following a rally ends up lower than the previous low (my definition of a dead cat bounce).
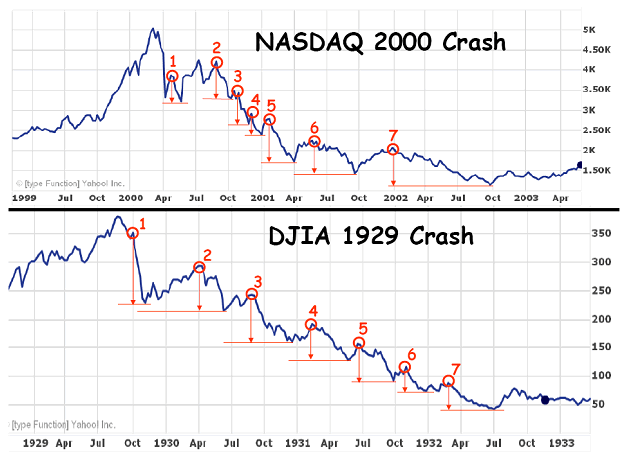
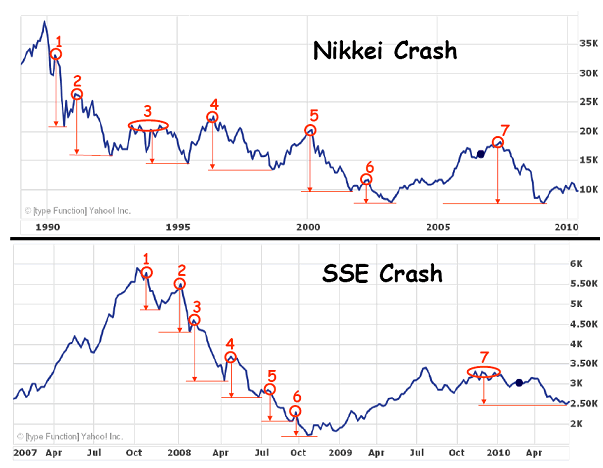
Looking at history, there is an intriguing number (7) for dead cat bounces following the burst of a bubble (which is what happens when what the Austrians call the “malinvestments” of the past (usually debt fuelled), get washed out of the system.
The “reality-check” often lasts for some time, five years is “normal” in USA, but in Japan it can take twenty (something to do with the hardness of the water and the quality of the detergent).


I admit that you need a certain amount of creative license to come up with the number seven…it’s all about deciding between a “Dead-Mouse-Bounce” and a “Dead-Cat-Bounce”, but anyway I like the number (7), it’s my answer to Fibonacci.
http://www.marketoracle.co.uk/Article12114.html
Either way, if you squint, rough numbers, it looks like a “typical” bubble-bust produces around-about seven dead cat bounces.
So where are we now with the S&P 500?
Well conventional wisdom says that bubble popped in 2008. But I have argued previously that the actual pop was in 2000 and that what happened from then to 2008 was simply a continuation of that pop as the “froth” got re-distributed onto bank balance sheets (remember them), and from there into malinvestments in everything from property and residential mortgaged backed securities (RMBS) to collateralized debt obligations (CDO), all exquisitely fuelled by AAA Rated New World Order Financial Engineering (NWOFE).
It’s a minority view, although that logic did predict the S&P 500 would turn at 675 (which it did if you don’t count intraday), and then it would go up until 1,200 or thereabouts, at which point it would turn down.
http://www.marketoracle.co.uk/Article19868.html
Other models are much more in line with conventional economic dogma (trailing P/E ratios, Tobin’s q, Elliot Waves, and Fibonacci), but the evidence of the recent past is that in spite of that (and inflation targeting, “velocity of money”, etc), they don’t seem to produce the right answer vey often.
Although that might be a bit unfair; after all Bob Prechter DID say “hold onto your shorts” in February 2008. I guess that might have had something to do with Warren Buffet’s quip “when the tide goes out you get to see who’s been swimming naked).
Anyway this is how that looks:

OK I accept that there are fractals when you look closer, and of course calling a “dead-cat” is an “art” ….and (for the purpose of brevity) I have only scratched the surface of that Black Art; although doubtless they will teach it to the new generations of MBA’s (hint: it’s all about finding your chakras).
But Big Picture, my take is that the S&P 500 is running out of dead cats.
So I’d be surprised to see a drop from the pinnacle of 1,200 to less than 950 at any point in the future, although I still don’t foresee a big bounce upwards for some time; from here on in it’s a “picker’s” market to “buy and to hold”.
“Oh” you say, “What about “earnings” and “double-dips”?
Sadly “earnings” as they are reported are something that are manipulated to varying degrees by a combination of taxation, which incentivises companies to pile on debt and create earnings outside of the tax jurisdiction where they can be massaged at will.
Plus you have accounting rules. Remember “profit” is the change of assets less liabilities over a period of time, and well you know what your liabilities are, but if you can play around with the valuations of the assets, then, like the accountant said to the prostitute:
“Profit sweetheart? What would you like it to be?”
There has been a lot of that going on over the past few years (Enron was just the appetizer).
Insofar as “double dips” are concerned, well they are almost irrelevant to the dynamics of the S&P 500 since the dynamics of bubble-pops (we are in post-bubble-pop right now), are much more pronounced, in terms of effect on the stock market than the difference between say 4% nominal GDP growth or a 2% contraction over a year.
But in any case, the trajectory of the stock market affects GDP, if stocks, or property prices, or toxic asset prices are up, like what happens in a bubble, then everyone feels rich so they spend money borrowed on the back of spurious valuations (and the government tell everything how smart they are), and post-bubble… they don’t.
Of course that’s at least the way GDP is measured, although it’s debatable how much “value added” is achieved concocting a CDO or something similar (re-distribution of wealth isn’t supposed to count as “value added”), but then again, in USSR they used to make tractors without engines, and count that as “value-added”.
But so what, 50% of the earnings of companies listed on the S&P 500 are generated outside of USA (and if they are manipulating their books so that they pay less tax (heaven forbid), that could be more like 70%), so who cares what happens in USA?
So long as the politicians are getting their pork.
By Andrew Butter
Twenty years doing market analysis and valuations for investors in the Middle East, USA, and Europe; currently writing a book about BubbleOmics. Andrew Butter is managing partner of ABMC, an investment advisory firm, based in Dubai ( hbutter@eim.ae ), that he setup in 1999, and is has been involved advising on large scale real estate investments, mainly in Dubai.
© 2010 Copyright Andrew Butter- All Rights Reserved
Disclaimer: The above is a matter of opinion provided for general information purposes only and is not intended as investment advice. Information and analysis above are derived from sources and utilising methods believed to be reliable, but we cannot accept responsibility for any losses you may incur as a result of this analysis. Individuals should consult with their personal financial advisors.
Andrew Butter Archive |
© 2005-2022 http://www.MarketOracle.co.uk - The Market Oracle is a FREE Daily Financial Markets Analysis & Forecasting online publication.


