


Gold Market Trend Review, The Bull Bear Debate
Commodities / Gold and Silver 2010 Jun 30, 2010 - 05:54 PM GMTBy: JD_Rosendahl

 There’s a lot of buzz about whether the gold market continues higher, or whether it’s time for a correction. The short answer is both are still a viable option.
Below is the daily chart of GLD. It’s grinding higher within a narrowing band of resistance and support trend lines. It looks tired based on divergences on both the RSI and MACD.
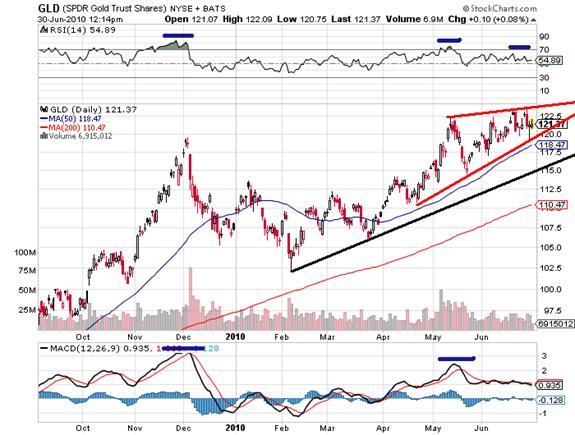
A break out is surely coming in the near future. A break below the red trend line is not terribly bearish, but a break below the black trend line is a more bearish signal. That daily black trend line is also the trend line on the weekly chart below.
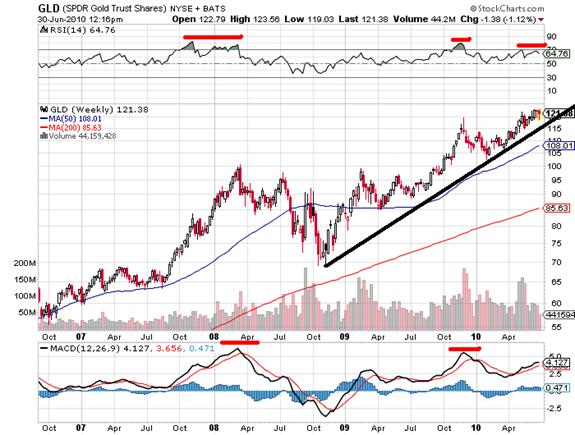
The weekly chart reflects bearish divergences on both the RSI and MACD, and volume has declined into recent highs. That also looks tired based on divergences on both the RSI and MACD.
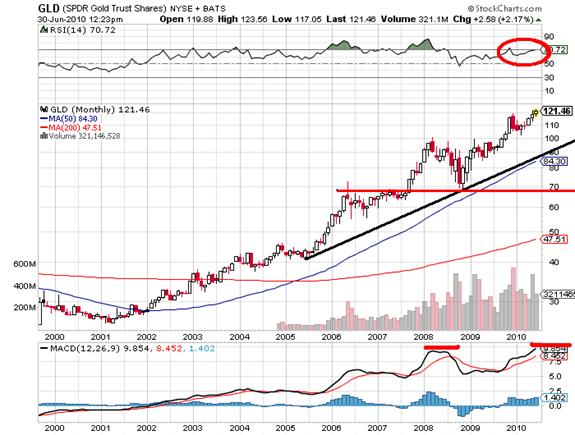
Below is the monthly chart of GLD. The good news is the monthly MACD has made a new high recently with price, and no bearish divergence exists. That leads me to believe the secular gold bull is still intact even if a near term correction begins.
The crux of the bull bear debate is essentially the following:
Melt ups occur from over bought conditions, especially in bubble conditions. The monthly MACD currently allows for more time for this to occur. Should GLD break above the daily resistance trend line a melt up could occur because there is no overhead resistance.
However, should the monthly MACD roll over, a correction of size in price and/or time is due. My down side targets are the monthly trend line, which is where the 50 month MA resides. My secondary target is the red line, which is price support. We haven’t visited the 50 month MA in ten years and it’s over due for a test.
Summary: Based on the technical structure of GLD, the risk is elevated for a larger sell off compared to the prior correction. The GLD simply looks tired. Therefore, we have sold a third of our gold bar position, and a couple of gold stocks. In essence, we have cut our total gold/gold stock position in half. It’s simply based on elevated risk, and we manage from the risk side first, making money second.
If we get the melt up, we will choose a time to unload, which may require patience or an averaging out strategy. If we get the self off or correction we look to average back into metals. If it is the sell off, it will take the monthly MACD months maybe a couple years to reach the zero line where I want to re-enter the PM market.
By J.D. Rosendahl
www.roseysoutlook.blogspot.com
J.D. Rosendahl was a former stock broker/investment consultant (currently not licensed) before becoming a Commercial Banker for the past 14 years. He manages his family's wealth, helping them avoid the high tech bubble and the real estate bubble melt downs and preserving wealth.
© 2010 Copyright J.D. Rosendahl - All Rights Reserved
Disclaimer: The above is a matter of opinion provided for general information purposes only and is not intended as investment advice. Information and analysis above are derived from sources and utilising methods believed to be reliable, but we cannot accept responsibility for any losses you may incur as a result of this analysis. Individuals should consult with their personal financial advisors.
© 2005-2022 http://www.MarketOracle.co.uk - The Market Oracle is a FREE Daily Financial Markets Analysis & Forecasting online publication.