Stock Market Resolves to Break Higher Leaving Bears in a State of Confusion
Stock-Markets / Financial Markets 2010 Jun 20, 2010 - 11:50 AM GMTBy: Nadeem_Walayat
 An early Monday stocks rally to just above Dow 10,300 concluded in a downtrend into the close to 10,200. The Dow opened up Tuesday, with the trend continuing higher into the end of the week with the Dow closing up 239 at 10,450 (10,211), which built on the preceding weeks 279 points advance.
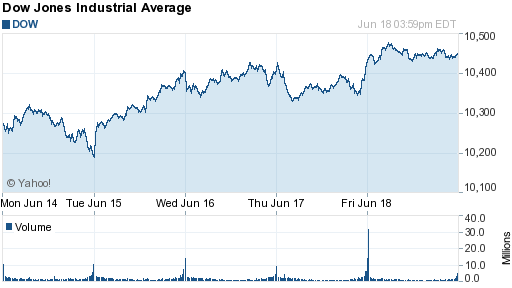
Last week-ends analysis (13 Jun 2010 - Stock Market Bulls Watch for a Higher High Whilst Bears Growl For New Lows ) concluded with an early Monday peak at around 10,300, to target a minor downtrend to 10,000 by Wednesday, with the Dow breaking above 10,300 by the end of the week.
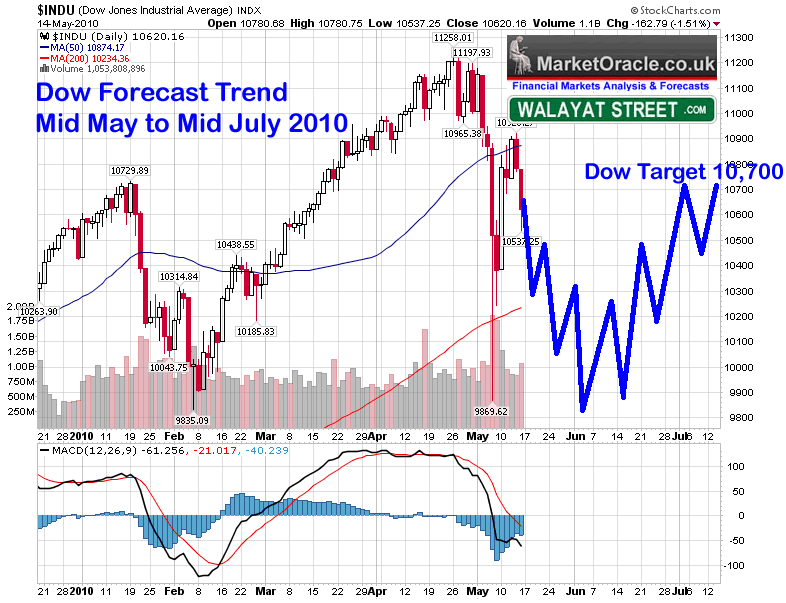
The overall trend continues inline with the big picture as detailed in the last in depth analysis and forecast - (16 May 2010 - Stocks Bull Market Hits Eurozone Debt Crisis Brick Wall, Forecast Into July 2010)
Which itself is inline with the even bigger picture as detailed in the Inflation Mega-trend Ebook over 4 months ago (FREE DOWNLOAD).
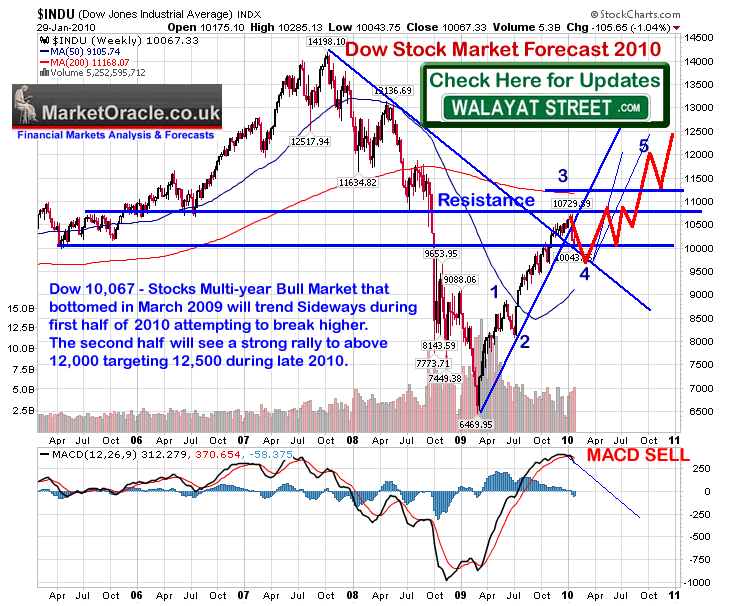
The overall trend pattern continues inline with the expectations for a corrective trading range that seeks to correct the preceding 13 month bull market into at least Mid July by which time I will have a clearer picture as to when the market is likely to break to new highs or if it will put in a further lower low i.e. to generate a large ABC pattern as the market enters the seasonally weakest part of the year for a low to be followed by a continuation of the stocks stealth bull market towards a late 2010 Dow target of between Dow 12,000 and 12,500.
The current trend continues to firm that the stock market has entered its up swing phase that targets 10,700+ by early July.
Range Producing Bearish Confusion
Its confusing to gauge where the bears stand, as a quick review shows a mixed picture of extreme vagueness, for instance Marc Faber, is now luke warm bullish on the stock market into September 2010 as his recent CNBC video illustrates.
Other prominent bears remain stuck in the view that April was the top, with the crash is coming crowd revising the crash is always imminent mantra virtually every other day, as if something written during the past 12 months with the word crash in the content is evidence that they called an eventual crash.
Bears Put Hopes on Low Volume Rally
Low volume rally mantra is again one of the driving forces behind bearish conclusions that stocks must head lower. However the obvious failure here is to recognise that the whole bull market has been on LOW volume which is indicative of a STEALTH bull market that RISES on low volume precisely because it is NOT being bought into by the majority of investors (both big and small), as I have repeatedly voiced over the past year i.e. - (02 Nov 2009 - Stocks Bull Market Forecast Update Into Year End )
VOLUME - Volume has been WEAK during the rally, which contrary to much bearish commentary implies that this rally has NOT been bought into. So all of the talk of hyper bullishness is basically rubbish as there is no sign of such irrational exuberance in the volume, which remains heavier on the declines than the rallies and thus suggestive of selling rather than buying into the rally. Which is good behaviour for a stealth bull market.
Sentiment
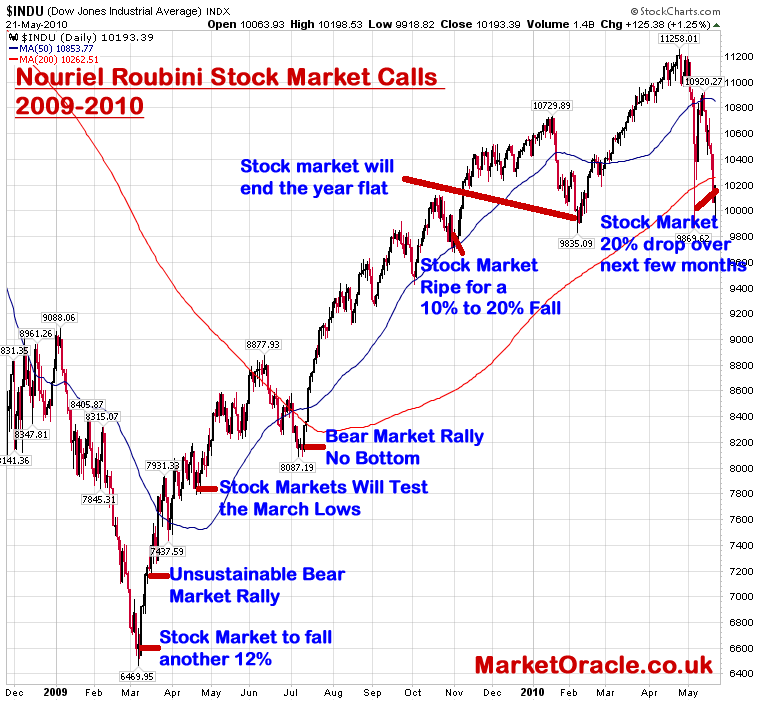
Sentiment wise it is mixed picture, which is how one would expect by now of an obvious trading range that is becoming more established in the psyche of market participants and hence much of the commentary out there in the blogosfear, a marked difference to when the Dow was bottoming out when the perma bears such as Nouriel Roubini were publically salivating on CNBC despite the fact that they are basically repeating virtually the same that is brought out towards the end of every correction since the stock market bottomed in March 2009 as illustrated in the article (23 May 2010 - Nouriel Roubini Stock Market 20% Drop Forecast, Time to Buy?)
Technical Picture
The Dow has put in a double bottom at about 9,800 that targeted a break above 10,300. The break above 10,300 to 10,480 targets a trend to 10,700+, probably at 10,900. However near term the breakout to 10,300 may require a retest i.e. stocks early next week revisiting 10,300 before continuing higher. This to me suggests a wide trading range for the week with an upward bias, i.e. early week decline before the Dow trend higher to above 10,500, how high ? there's not much resistance between the current price and Dow 10,700.
On the negative side a break below 10,300 could suck the Dow back into the 10,300 - 9,800 trading range, though last weeks price action suggests this is not going to happen, in fact suggests 10,300 is going to act as a strong support level.
Conclusion
Early week weakness is expected to be supported at Dow 10,300 for a trend higher into the end of the week which could include the Dow trading above 10,700, targeting a close in the region of 10,550 to 10,600, up 100 to 150 points on the week. The risk to this scenario is if 10,300 support folded with the Dow being sucked back into the vortex of the 10,300 - 9,800 trading range.
Big Picture- Sideways corrective trading range continues with current trend in the UPSWING Phase that Targets 10,700+ by early July.
Gold Brief
Gold hit a new all time high this week, my long standing target of $1,333 is now not so far away. I am repeatedly asked when to buy ? Well you accumulate into bull markets on corrections as I have indicated several times during the past few weeks when Gold was trading at $1,175. Look buying Gold at $1,250 or $1,150 makes little difference in profit terms if Gold gets to $2,000 (as I expect it to) and probably a lot higher.
Obama $20 Billion Shakedown of BP
Obama gangster style put a gun to BP and said to cough up $20 billion instantly or else. Perhaps the Indian government should likewise threaten Union Carbide to pay up $20 billion for the 5,000+ Bhopal indian deaths or else?
Congress barbequed the CEO of BP. However what BP needs to do is to kill that damn oil well, then they can let the lawyers let rip to determine how much of the blame and ultimately the costs lie with Haliburton, Transocean, Anadarko Petroleum, Regulators and BP. I especially noted Anadarko Petroleum who own 25% of the well, and hence are liable to 25% of the costs were squirming to offload 100% of the blame on to BP, probably because Anadarko Petroleum could not survive being hit with anything like 25% of the liabilities (BP owns 65% of the well hence legally is only responsible upto a maximums of 65% of the eventual costs unless U.S. Law just exists for publicity purposes).
Deepwater Oil Spill, Peak Oil and the Inflation Mega-Trend
The Deepwater spill is the first of many more similar spills or rather ocean oil well blowouts to come because virtually all of the cheap easy to get at oil has gone, the only oil left to get is the expensive high risk difficult to get at deep water sources. This means higher oil prices which means higher inflation.
Don't be confused by oil being just another commodity, it is not, it is the life blood of our way of life as we exist in the oil age. The impact of higher oil prices, and we are talking about $200+ are highly inflationary because basically ALL currencies at the end of the day are priced in how much oil they can buy, so I can imagine there will come a day when goods are priced in terms of how many gallons of crude oil its taken to produce them. Which means the measure of wealth will shift to those that have oil resources from those that have paper wealth, which is a manifestation of the inflation trend as paper wealth goes up in smoke therefore people need to change their mindset when they view their wealth, they need to view it in terms of how much is held in scarce resources with oil at its pinnacle, because nothing can be resourced, grown or and supplied without oil as opposed to cash sat in the bank on pittance sub CPI interest rates as UK savers are having to currently suffer, as its value is being effectively stolen by the government via the inflation stealth tax.
World Cup
England players are complaining that the fans are booing them on the pitch, well then the players should stop playing crap!
Your peak oil inflation mega-trend investing analyst.
Comments and Source: http://www.marketoracle.co.uk/Article20457.html
By Nadeem Walayat
Copyright © 2005-10 Marketoracle.co.uk (Market Oracle Ltd). All rights reserved.
Featured Analysis of the Week
|
|
|
|
|

|
|
|
|
|
|
|
|
|
|
|
|
|
|
|
Most Popular Financial Markets Analysis of the Week :
| 1. Gold Going to Parabolic Top of $10,000 by 2012 For Good Reasons |
By: Lorimer_Wilson
No wishful thinking here! As I see it gold is going to a parabolic top of $10,000 by 2012 for very good reasons - sovereign debt defaults, bankruptcies of “too big to fail” banks and other financial entities, currency inflation and devaluations - which will all contribute to rampant price inflation.
| 2. Implications of the Gold Silver Price Divergence... |
By: Robert_Murphy
Austrian economics is superior to Marxism in every respect, and this includes internal, sectarian squabbles. When we Austrians feel the time is ripe for another bloodletting — it keeps us strong by thinning the herd once in a while — we argue over fractional-reserve banking.
| 3. Stock Market Bulls Watch for a Higher High Whilst Bears Growl For New Lows |
By: Nadeem_Walayat
Disappointing U.S. retail sales data on Friday failed to dent the stock market as it closed higher on the day and the week at Dow 10,211, up 279 (9,932). From the start of the week the stock market trended lower into an early week low at just below 9,800 that was followed by a volatile uptrend right into Friday's close.
| 4. Two Decades Of Debt Induced Greed Unraveling into the Greater Depression |
By: James_Quinn
We are currently in the midst of a Fourth Turning. This twenty year Crisis began during the 2005 - 2008 timeframe with the collapse of the housing bubble and subsequent repercussions on the worldwide financial system. It is progressing as expected, with the financial crisis deepening and leading to tensions across the world. It will eventually morph into military conflict, as all prior Fourth Turnings have. The progression from High to Awakening through the Unraveling took from 1946 until 2006. The most treacherous period of the Saeculm is upon us.
| 5. End Game, Gold Investors Will be Destroyed |
By: Shelby_H_Moore
Trail of tears and broken dreams (delusions) lies ahead...
Gold will go very high in fiat value, that is not the problem.
| 6. The Inflation Mega-Trend Continues With UK CPI 3.4%, RPI 5.1% |
By: Nadeem_Walayat
Another month and another release of UK inflation data at far above the Bank of England's target of 2% and above the upper limit of the Banks 1% to 3% range by reporting CPI of +3.4% for May. Thus the BoE Governor, Mervyn King will write another letter to repeat that the high rate of inflation is just "temporary", though when does "temporary" high inflation stop being temporary? 6 months? a year? 2 years? as the country sleep walks into stagflation with all of the consequences for wage earners and savers.
| 7. The Next Catastrophic Bubble to Pop Will Be Private Sector Debt |
By: Andrew_Butter
Much is said about the propensity of USA to pile on public debt to try and right the wrongs of the moronic lenders of yester-year ….and the risks that entails, but private sector debt is a much bigger “Elephant” in the Jacuzzi than public sector debt.
| 8. What the End of the Oil Age Looks Like |
By: Richard Heinberg
Following the failure of the latest efforts to plug the gushing leak from BP’s Deepwater Horizon oil well in the Gulf of Mexico, and amid warnings that oil could continue to flow for another two months or more, perhaps it’s a good time to step back a moment mentally and look at the bigger picture—the context of our human history of resource extraction—to see how current events reveal deeper trends that will have even greater and longer-lasting significance.
| Subscription |
You're receiving this Email because you've registered with our website.
How to Subscribe
Click here to register and get our FREE Newsletter
| About: The Market Oracle Newsletter |
The Market Oracle is a FREE Financial Markets Forecasting & Analysis Newsletter and online publication.
(c) 2005-2010 MarketOracle.co.uk (Market Oracle Ltd) - The Market Oracle asserts copyright on all articles authored by our editorial team. Any and all information provided within this newsletter is for general information purposes only and Market Oracle do not warrant the accuracy, timeliness or suitability of any information provided in this newsletter. nor is or shall be deemed to constitute, financial or any other advice or recommendation by us. and are also not meant to be investment advice or solicitation or recommendation to establish market positions. We recommend that independent professional advice is obtained before you make any investment or trading decisions. ( Market Oracle Ltd , Registered in England and Wales, Company no 6387055. Registered office: 226 Darnall Road, Sheffield S9 5AN , UK )
© 2005-2022 http://www.MarketOracle.co.uk - The Market Oracle is a FREE Daily Financial Markets Analysis & Forecasting online publication.


