


Dow, Gold and Crude Oil Breaking Out or Just Bouncing?
Stock-Markets / Financial Markets 2010 Jun 20, 2010 - 10:42 AM GMTBy: Chris_Vermeulen

 Over the years we have seen the stock market make some pretty exciting moves for share holders. This year alone there have been some interesting events unfold causing wild market swings which most of us did not think could happen. Things like countries going bankrupt and the May flash crash. Also the BP Oil well leak which looks as though its about to kill not only businesses around the world but a large population of animals and fish which our planet will never be able to get back… It’s been a crazy year!
It sure would be nice if the financial situations between all he countries could be resolved, and if we could have some proper regulations on banks and the financial system to minimize fraud and manipulation. From the looks of everything we have a few years still before things get sorted out, fixed and some what stabilized.
Below are some charts showing where the Dow, Gold and Oil are currently trading and my thoughts on them.
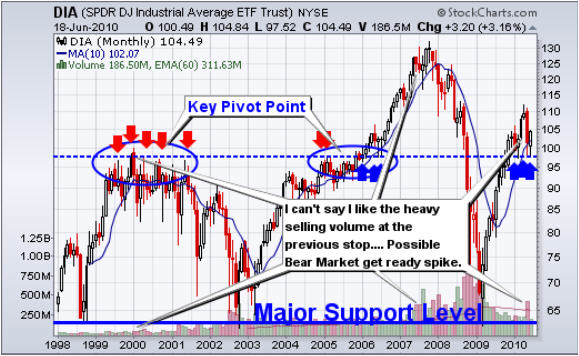
DIA – Dow Jones Industrial Average ETF – Daily Chart
The past 12 years we have seen the DJIA go through some large bull and bear markets providing those with trading experience to generate large profits in both the bull and bear markets.
Recently we have seen the DJIA pullback and test the key pivot point and has started to bounce. Although this price action is positive I have my doubts about another bull market rally because of how the chart looks. I focus most of my analysis on chart patterns, volume and market internals. These allow me to monitor the overall heath of the market on a daily, week and monthly basis. Using these techniques I am able to pull money from the market consistently.
This year we saw some extremely heavy selling in May which could have been strong enough to shift the trend from an up trend to a down trend. I call these large volume candles Get Ready Spikes. If they are green then we are looking for higher prices but when they are red it means distribution is starting and lower prices could start to form in the coming months.
The DIA chart below looks to be forming a very large head and shoulders pattern which is currently trading near the top of the right shoulder. This pattern is very bearish and points to much lower prices in the next couple years if the major support level (neckline) is broken.
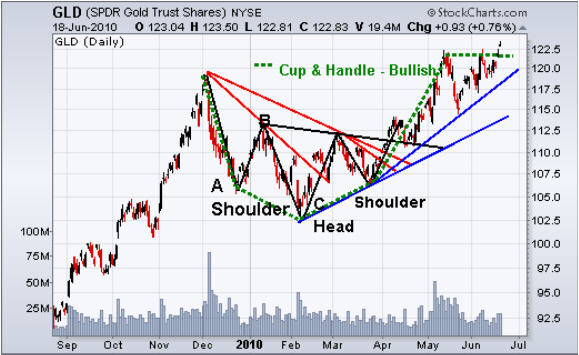
GLD – Gold Exchange Traded Fund – Daily Chart
The chart of gold shows the same cup and handle pattern which I have been talking about for a while now. Last week the price of gold made a new high breaking out of this pattern. We could see the price of gold start to work its way up to the $1400-1500 level over the next 3-6 months which calculates to $140-150 on the GLD etf.
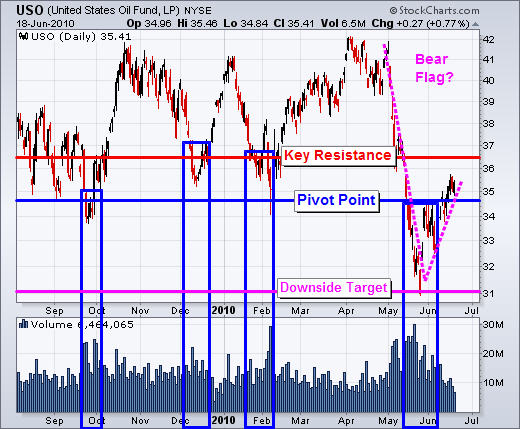
USO – Crude Oil Fund – Daily Chart
USO oil fund has been trend down for a couple months and recently put in a nice bounce from the May low. I feel as though oil is forming a bear flag and could head lower in the coming weeks. Until it breaks the key resistance level traders must be cautious if they have any long trades right now.
Weekend Dow, Gold and Oil Trading Conclusion:
In short, I’m bullish on stocks for the short term and think we could retest the April high in the next month or two. But after that the market could roll over and from there we could see much lower prices. Or we could see the indexes breakout and start another leg higher… During volatile times like we are in now… we must trade with caution until the overall health of the market clearly indicates the direction of stocks. Until then focusing on low risk setups and taking profits quickly is the safest trading strategy.
Gold looks to be setup for a strong move higher. I am hoping for another dip to shake out some investors before it continues its march upwards. Oil on the other hand is trading near a key resistance level. Only time will tell if it can break through and start a rally. If not then we will see the market struggle.
If you would like to receive my ETF Trading Signals take a look at my website: www.TheGoldAndOilGuy.com
By Chris Vermeulen
Chris@TheGoldAndOilGuy.com
Please visit my website for more information. http://www.TheGoldAndOilGuy.com
Chris Vermeulen is Founder of the popular trading site TheGoldAndOilGuy.com. There he shares his highly successful, low-risk trading method. For 6 years Chris has been a leader in teaching others to skillfully trade in gold, oil, and silver in both bull and bear markets. Subscribers to his service depend on Chris' uniquely consistent investment opportunities that carry exceptionally low risk and high return.
This article is intended solely for information purposes. The opinions are those of the author only. Please conduct further research and consult your financial advisor before making any investment/trading decision. No responsibility can be accepted for losses that may result as a consequence of trading on the basis of this analysis.
Chris Vermeulen Archive |
© 2005-2022 http://www.MarketOracle.co.uk - The Market Oracle is a FREE Daily Financial Markets Analysis & Forecasting online publication.