


GLD, GDX and GDXJ True Strength Index Momentum
Commodities / Gold and Silver 2010 Jun 18, 2010 - 12:35 PM GMTBy: John_Townsend

 The True Strength Index is a low lag-time momentum indicator that can be used at www.FreeStockCharts.com. Generally, it is bullish when the indicator is above ZERO and bearish when it is below ZERO. As the indicator is very sensitive and responsive to movements of price, it can be effectively interpreted for buy and sell decisions.
GLD is making new all-time highs today. So let’s see what the momentum indicator is telling us. Below is a chart of the hourly price action of GLD.
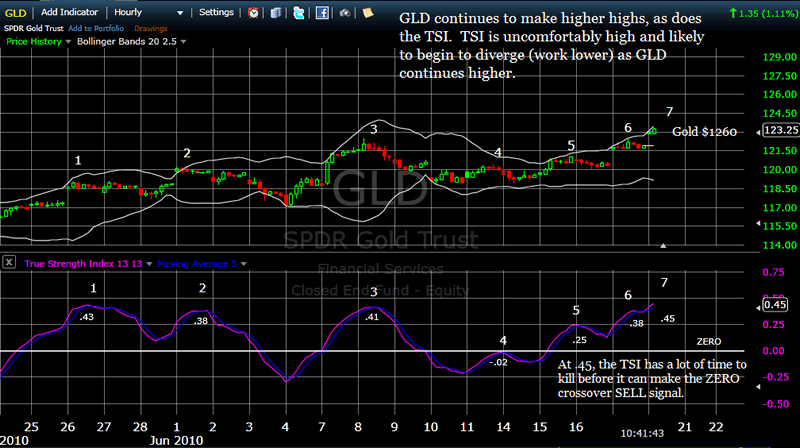
A couple of things are obvious. First, the price performance of GLD has been steadily accelerating for the past 6 trading sessions. This is significant because it means that as the acceleration begins to slow, price could still continue higher – but climbing at a slower rate. As the current reading is .45, which is relatively high, I think it likely that gold will continue to rise while the TSI momentum indicator will begin to diverge (trend lower).
There are a couple of techniques for making a sell decision with this setup. One could simply wait for the TSI indicator to finally cross below ZERO – which will be some time from now, or sell when the indicator makes it first divergence (a lower high if price is still going higher). A third technique, and one that you should be forewarned of whipsaw, is to buy/sell when the indicator crosses the moving average (purple line).
For the past 4 months, GDX has been advancing in a pattern of 3 momentum waves followed by a correction. While there is no guarantee that this particular pattern will continue, it is encouraging to note that we have recently been through both a correction and a consolidation phase and are just beginning a new first wave.
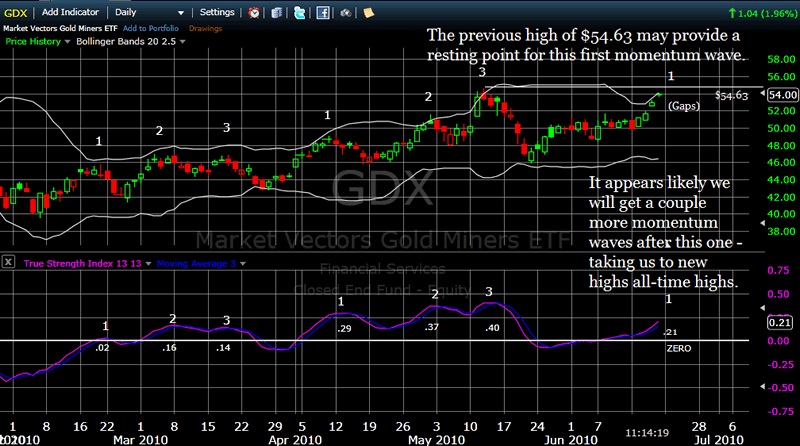
It would surprise me if GDX does not ultimately take out the previous all time high of $54.63. For now we observe open gaps in daily trade that may be revisited on a future date. But for now, this looks like a powerful first wave that should logically be followed by others.
The chart of GDXJ, not surprisingly, is similar to that of GDX.
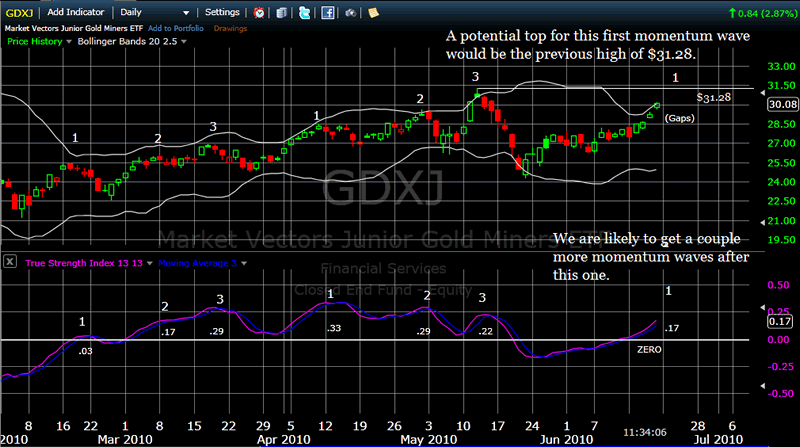
The previous GDXJ high of $31.28 may provide a resting point for this first momentum surge. Like GDX, GDXJ has been progressing upward in a pattern of three True Strength Index highpoints.
The second set or group of 3 highpoints is instructive. .33 then .29 then .22. This is an excellent example of price making higher highs while the indicator begins to diverge with lower highs. It simply illustrates that the rally is losing steam and something to be on the lookout for in making buy/sell decisions. Again, I think it very likely we will see this phenomenon in the upcoming week with GLD. If we do that should encourage longs to inch themselves closer and closer to the door.
John Townsend
mailto:TSItrader@gmail.com
© 2010 Copyright John Townsend - All Rights Reserved
Disclaimer: The above is a matter of opinion provided for general information purposes only and is not intended as investment advice. Information and analysis above are derived from sources and utilising methods believed to be reliable, but we cannot accept responsibility for any losses you may incur as a result of this analysis. Individuals should consult with their personal financial advisors.
© 2005-2022 http://www.MarketOracle.co.uk - The Market Oracle is a FREE Daily Financial Markets Analysis & Forecasting online publication.