Stock Market Bulls Watch for a Higher High Whilst Bears Growl For New Lows
News_Letter / Financial Markets 2010 Jun 16, 2010 - 12:54 AM GMTBy: NewsLetter
 The Market Oracle Newsletter
June 13th, 2010 Issue #35 Vol. 4
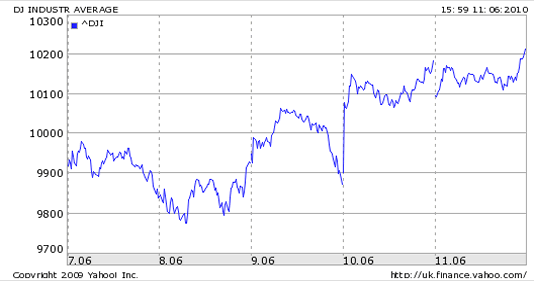
Stock Market Bulls Watch for a Higher High Whilst Bears Growl For New LowsInflation Mega-Trend Ebook Direct Download Link (PDF 3.2m/b) Dear Reader Disappointing U.S. retail sales data on Friday failed to dent the stock market as it closed higher on the day and the week at Dow 10,211, up 279 (9,932). From the start of the week the stock market trended lower into an early week low at just below 9,800 that was followed by a volatile uptrend right into Friday's close.
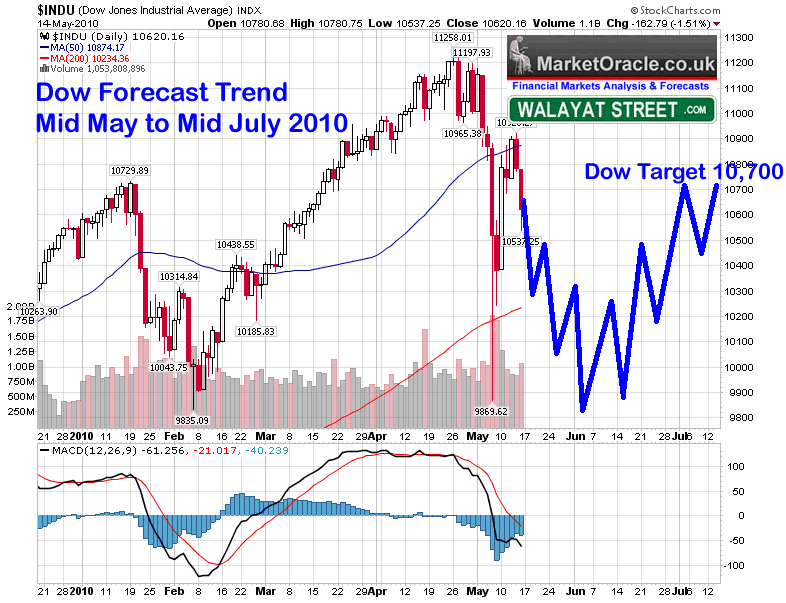
Last week-ends analysis (06 Jun 2010 - Stock Market Plunge on Disappointing Jobs Data, What's Next?) concluded in a trend that targeted an early week low at between 9,800 and 9,850 before a rally commenced that targeted a trend to Dow 10,350, which pretty much matches this weeks actual trend. And as part of the big picture as part of the in depth analysis and forecast - (16 May 2010 - Stocks Bull Market Hits Eurozone Debt Crisis Brick Wall, Forecast Into July 2010) Stock Market Conclusion Despite the flash in the pan crash and prevailing Eurozone sovereign debt default gloom and doom, the bottom line is that this is still a stocks bull market with the Dow ONLY down less than 6% from its bull market peak. Therefore the sum of the above analysis concludes towards the stocks bull market under going its most significant and a highly volatile correction since its birth in March 2009 (15 Mar 2009 - Stealth Bull Market Follows Stocks Bear Market Bottom at Dow 6,470 ). This correction could last for several months and may extend all the way into early October, which suggests that the next 2 months are going to see an ABC correction to be followed by a sideways price action between the extremes of 10,900 to 9,800 and so despite continuing wild gyrations I would not be surprised if the Dow is little changed from its last closing price of 10,620 in 2 months time (16th July 2010). Expectations remain for the bull market to resume its trend towards a target of between 12k to 12.5k by late 2010 after the tumultuous trading period over the next few weeks. I have tried to illustrate a more precise Dow forecast projection in the below graph, reality will probably end up being far more volatile.
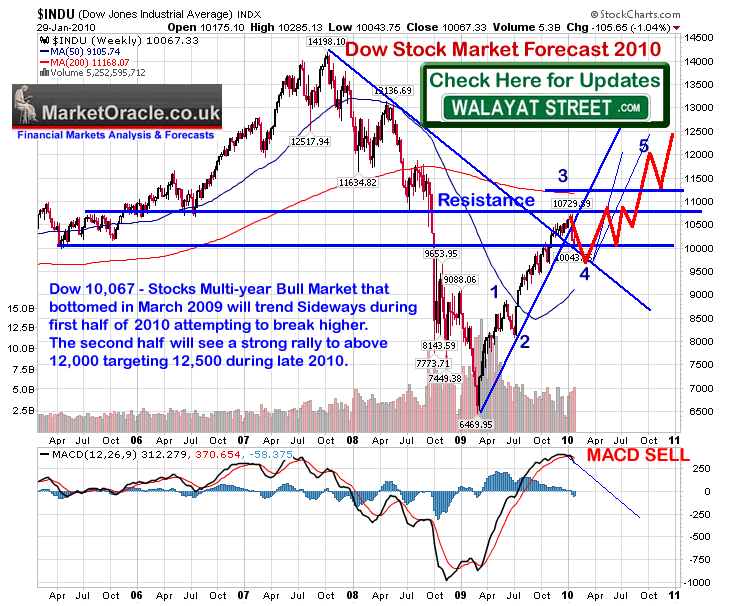
The stock market spent a good 1 1/2 days below 9,900 where with each hour offering the bears an increasing opportunity to pronounce again the re-commencement of the Bear Market, though conveniently forgetting having missed the whole bull market to date. Still without the BlogosFear and inept mainstream media, you don't get stocks bull markets where most investors remain too scared to invest into hence a STEALTH bull market. So far this correction has not done ANYTHING to suggest to me that it is anything other than correcting the preceding 13 month bull run, in fact in trend terms it is pretty close to the forecast run for the year as indicated by the below graph of the even BIGGER Picture from the Inflation Mega-trend Ebook over 4 months ago (FREE DOWNLOAD). The current trend is inline with the expectations for a corrective trading range into at least Mid July by which time I will have a clearer picture as to when the market is likely to break higher or if it will put in a further lower low in the seasonally weakest part of the year i.e. Sept / October, followed by rally to achieve the late 2010 Dow target of between Dow 12,000 and 12,500. The perma-bears and the crash is coming again crowd that emerge after every market sell off and usually near market bottoms are clearly concluding that April was the top, as was Jan before that and October 09 before that and August 09 before that and April 09 before that. What I find perplexing is if the highly vocal perma-bears never bought in the first place then exactly what are they selling ? When I see the likes of ultra-safe oil stocks (barring killer oil spills) such as Shell at £17.92 trading on a P/E of 8 and yielding 7.5%, I don't see a market that is expensive, I see a market that is dirt cheap to continue accumulating into for the long-run. The immediate trend shows a tightening of the range to between Dow 10,300 and 9,800. With the close of 10,211 propelling the Dow towards the upper end of this range. The question mark is when will the Dow break through 10,300?. Immediate action resolves towards an assault on the 10,300 area. But will it break? Given the high volatility and the fact that we are effectively still in a down trend, I will have to conclude with the upper end of the range holding on the first assault and thus pushing the Dow back down to Dow 10k by Mid week before it can set itself up for another attempt at breaking above Dow 10,300 and then target Dow 10,700 further out. On the Downside I will be looking for Dow 10k to hold, every point the market trades below 10k weakens the probability of an upside breakout this week. On a worse case basis that Dow may in actual fact put in a lower high and thus target a break below 9,800 to test the bottom again. Despite last weeks highly accurate conclusion, it really is a case of weighing up which is the more probable outcome of what amounts to price action within a tightening trading range. Conclusion - The volatile trading range continues, immediate action targets Dow 10,300 Monday which will probably hold the advance for a trend lower to Dow 10k by mid Wednesday (for a higher low) before the market again gears itself up for an attempt to break above Dow 10,300 (should succeed) to target Dow 10,700+ as the Dow enters the important upside phase of its wider trading range that effectively seeks to end the current existing downtrend pattern off of the April top of lower highs and lows, thus I will be closely watching firstly the nature of any trend below Dow 10k and secondly for a break above Dow 10,300. BP - American Petroleum's Attempts At Capping the Oil Gusher American Petroleum formerly known as BP aka British Petroleum continues to fail to fill the black hole that is swallowing up the whole of Gulf of Mexico. There is talk that the amount of oil released is double that previously estimated, I would not be surprised if it were a lot higher than that. Whilst american politicians are eager to blame the foreigners and want to dance on the corpse of BP, though are conveniently forgetting that BP is more American than British as evidenced by the fact that BP Pays $4.7 billion in tax in the U.S. compared with $1.7 billion in tax in the UK, BP employs 23,000 workers in the U.S. against 15,000 in the UK and that the BP board of directors is split 50/50 between 6 American and 6 British directors. Similarly BP is 40% owned by American shareholders as one of the largest group of investors, so talk off canceling the dividend will hit American investors hard. BP's prime failure here was to offshore production to Trans ocean that was responsible for the oil rig disaster, which itself will soon be paying out $1 billion in dividends and against which there has not been a whisper of a dividend cut. Culpability also lies with the U.S. oil industry regulator that apparently were busy watching porn films and collecting back handers so as not to do their job. Meanwhile the oil keeps gushing and has probably passed over 1 million barrels, which is four times that of the Exxon Valdez, but 1/3rd that of the Mexico Ixtoc1 spill of 1979 at 3.3 million, with the grand daddy of ocean oil spills being the First Gulf War at about 10 million barrels. Icy Tar Balls Coming to Europe? Whilst the under ocean oil slick continues to expand, William Engdahl reminded us of the Gulf Stream current which means that European coastlines may also in the coming months be being visited by tar balls, not to mention the far more dangerous environmental risk if the Gulf Stream current was affected in which case Europe in a worse case scenario could forget about Global Warming, but instead say hello to the ICE AGE! BP Kick Ass Solutions Apparently President Obama is gearing up to kick ass, starting with his own? If things weren't bad enough for BP in the Gulf, the board of directors were hit by a second slick which consumed more precious time (video). Gold and U.S. Dollar I have received several email requests for in-depth updates for both markets which I will seek to do for one this week. However both the Dollar and Gold remain in bull markets. With the USD targeting 89 - achieved (so much for the dollar collapse mantra), and Gold $1333 (deflationists what happened?), though gold is entering its seasonally weakest period of the year which is not suggestive of an imminent breakout higher. What I found particularly amusing recently was a prominent Gold bear of many years who now says he has been a Gold bull all along! In the meantime the following are conclusions from the Inflation Mega-trend Ebook (FREE DOWNLOAD). Gold Price Forecast ConclusionThe two key conclusions are: 1. That the current correction is targeting $1050 to be achieved during February 2010 2. That Gold is targeting an Impulse Wave 5 into late 2010 peak of at least $1333 which remains as per the original forecast of 1st November 2009. Both the Dollar forecast and the seasonal trend are supportive of the view for Gold price relative weakness into July / August 2010, following which the Gold price is expected to break out to a new high. This suggests that Gold may trend sideways for the first half of 2010 into July / August as the following graph concludes: Gold Beyond $1333 As mentioned earlier, $1333 is just a target for 2010, the Gold price may even reach as high as $1,400 this year, enroute towards my longer-term target of $2,000 which would basically represent a 85% gain on the current price of $1081 and much more so when Gold stocks are brought into the equation though there trends are also subject to that of the general stock market. U.S. Dollar Bull Market Many analysts have only recently begun to wake up to the reality of a bullish trend expectations for the U.S. Dollar having missed the boat with relentless and persistent calls of a U.S. Dollar crash for the past 2 years that NEVER materialised, with the "black swan" excuse repeatedly trundled out to explain away the reason for consistently being wrong on the dollar. Though off course a dollar rally amidst the inflationary mega-trend which depreciates all currencies is just a function of the fact that the other currencies are depreciating at a faster rate! However, I did correctly identify the trend for a U.S. Dollar bottom way back in March 2008 which subsequent analysis has continued to confirm and support in the face of continuous calls of a collapse to new lows as the following illustrate - Summary of Key USD Bull Market Analysis
The U.S. Dollar has since rallied off of the lows at just above USD 74 to presently stand at a new high for the move of 79.50, which is a weak rally given the time taken to reach current levels, therefore remains on target to reach 84 within the next few months, after which a correction can be expected to bring the USD back towards 80. The 3 month or so bullish dollar trend therefore is suggestive of weakness for stocks and commodities going forward due to the inverse relationship. Though Gold, Stocks and the Dollar have all managed to rally since October 09 which again is a function of the inflation mega-trend i.e. on going depreciation of all currencies against scarce resources and assets.
What a racket, I mean the noise at the matches, am I the only one being distracted by the constant mindless loud drone of the vuvuzela? No beat, no rhyme, no rhythm just a constant IRRITATING DRONE ! South Africa, Ban it or you WILL lose millions of viewers! 1-1 : Is England's Goal Keeper America's 12th player? Source and Comments : http://www.marketoracle.co.uk/Article20257.html Your Analyst. By Nadeem Walayat Copyright © 2005-10 Marketoracle.co.uk (Market Oracle Ltd). All rights reserved. Featured Analysis of the Week

Most Popular Financial Markets Analysis of the Week :
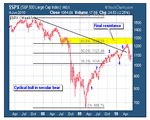
By: Anthony_Cherniawski U.S. stocks lost their gains Wednesday as Federal Reserve Chairman Ben Bernanke voiced cautious optimism about the economy and the central bank's Beige Book also noted modest improvement. "Everything is universally moving in the right direction, but we already knew that," said Jeffrey Kleintop, chief market strategist at LPL Financial of the Fed's June report, which noted improvement across all 12 districts.
By: Clive_Maund In this article we are going to consider the implications of gold’s new highs of late last year and a month or so ago not being confirmed by new highs in either silver or the Precious Metal stock indices, and consider other factors having an important bearing on the outlook. Normally such a non-confirmation results in a reversal, if it persists, which is why it is a focus of concern at this time.
By: Nadeem_Walayat The Dow closed the week sharply lower on Friday at 9932 against last weeks close of 10,136. The stock market had exhibited a tightening of its trading range for most of the week following a bounce off an early week low of 10,014 into a rally peak of 10,315 Thursday, as the market marked time ahead of the Fridays Jobs Report that disappointed market participants and resulted in a 333 point drop on the day right from the opening gap down and trend lower all the way into the close.
By: F_William_Engdahl The Obama Administration and senior BP officials are frantically working not to stop the world’s worst oil disaster, but to hide the true extent of the actual ecological catastrophe. Senior researchers tell us that the BP drilling hit one of the oil migration channels and that the leakage could continue for years unless decisive steps are undertaken, something that seems far from the present strategy.
By: Ty_Andros The “When hope turns to Fear” moment (See 2010 Outlook “When hope turns to Fear” in Tedbits archives) is unfolding as we speak, as the tides of insolvency sweep over the social welfare states and financial systems of the developed world. It is the next leg down in the global financial crisis and what will come to be known as the greatest depression ever is commencing -- we are fascinated and astonished at what the main stream media is reporting and failing to report.
By: Steve_Betts "Our government has kept us in a perpetual state of fear - kept us in a continuous stampede of patriotic fervor - with the cry of grave national emergency. Always, there has been some terrible evil at home, or some monstrous foreign power that was going to gobble us up if we did not blindly rally behind it." ---General Douglas MacArthur (1880-1964)
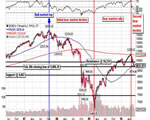
By: Hans_Wagner This is a monthly chart for the S&P 500 showing 20 years of performance. Since this index is the one used by professional traders, it is important to understand how it is performing. This chart is also excellent at defining the longer-term trends for the market.
By: Gordon_T_Long It will likely surprise you but like a trolley car we are now locked into economic tracks that determine our financial destination. Unfortunately, it isn’t a place anyone would choose knowingly other than possibly the Bilderberg elite.
You're receiving this Email because you've registered with our website. How to Subscribe Click here to register and get our FREE Newsletter To access the Newsletter archive this link Forward a Message to Someone [FORWARD] To update your preferences [PREFERENCES] How to Unsubscribe - [UNSUBSCRIBE]
The Market Oracle is a FREE Financial Markets Forecasting & Analysis Newsletter and online publication. |
|||||||||||||||||||||||||||||||||||||||||||||||||||||||||||||||||||
© 2005-2022 http://www.MarketOracle.co.uk - The Market Oracle is a FREE Daily Financial Markets Analysis & Forecasting online publication.



 South Africa World Cup Football on Mute