Stock Market Timing Correlation Against Currencies
Stock-Markets / Stock Markets 2010 Jun 14, 2010 - 03:12 PM GMTBy: Graham_Summers
 Pop Quiz: what do you get when you combine a stock market completely overrun by computer programs with central bankers who believe currency debasement is a means to generate real wealth?
Answer: insane volatility in which the entire market follows various asset classes tick for tick.
Let’s take a trip down memory lane.
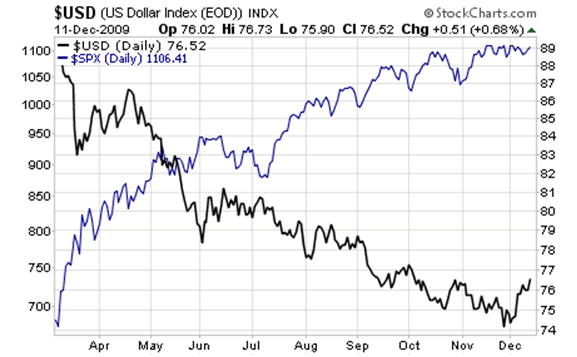
After the Federal Reserve announced its Quantitative Easing program in March 2009, the US stock market (as illustrated by the S&P 500) began to trade in an absurd correlation to the US dollar.
Of course, stocks and the US Dollar had maintained something of an inverse correlation for years (meaning one fell when the other rose). I use the word “absurd” for the relationship between the two assets in 2009 because for much of that year the correlation was -0.98 (see below).

Let’s be blunt: correlations of this perfection ARE NOT supposed to happen in the financial world. To give you an idea of how ridiculous a -0.98 correlation is, consider that historically, Gold and the US Dollar, which are generally considered to have a perfect inverse relationship, have actually maintained a correlation of around -0.27.
A -0.98 correlation is only possible when you’ve got two things:
- A market dominated by computer trading programs that trade based on correlations
- A Central Banker intent on debasing a currency to reflate the stock market
Unfortunately for Bailout Ben Bernanke, his debasement efforts were thwarted when Europe began to implode courtesy of Greece’s debt issues. Consequently, the Euro collapsed forcing the US Dollar higher (the Euro accounts for more than 50% of the US Dollar index).
This blew up the US Dollar carry trade (traders were borrowing in US Dollars at 0% to invest in higher yielding assets, pocketing the difference in the yield spread). Which helps explain the collapse of the S&P 500 in late January 2010.
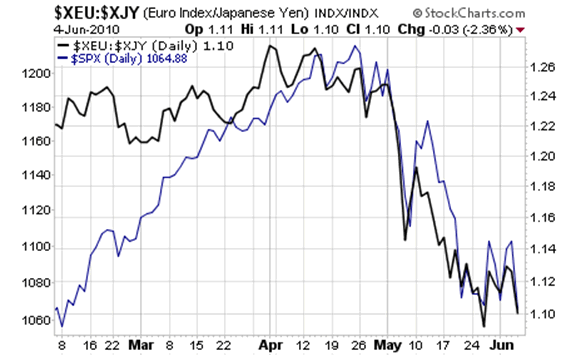
With the US Dollar now rallying, traders needed another “debasement-friendly” currency to borrow in. Not surprisingly, they turned to “Old Faithful,” the one currency that has been a carry-trading investor’s best friend for years: the Japanese Yen:

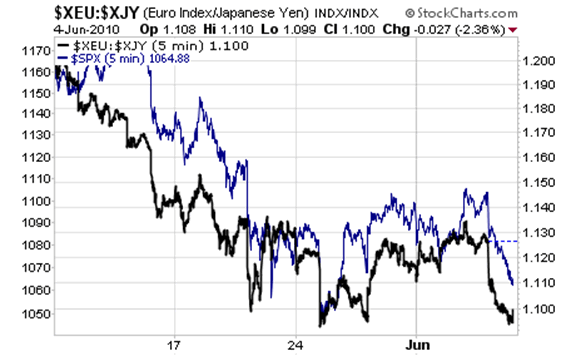
As traders moved into this trade, the momentum chasing computer programs followed suit. What followed was the market shifting away from its correlation to the US Dollar and into a near perfect correlation to the Euro/ Japanese Yen. Indeed, the perfection of the correlation is even more absurd when you take the chart down to 5-minute increments:

As you can see, the S&P 500 (blue) is now following the Euro (priced in Yen) tick-for-tick.
Will this relationship last forever? No. Like the US Dollar/ S&P 500 correlation of 2009, at some point this will blow-up, most likely when the Euro finally puts in a serious dead-cat bounce.
However, in the meantime this is a market timing indicator that is darn near flawless. Day traders take note, this is the correlation the computers are favoring. Use it while it lasts.
Good Investing!
Graham Summers
PS. If you’re worried about the future of the stock market, I highly suggest you download my FREE Special Report detailing SEVERAL investments that could shelter your portfolio from any future collapse. Pick up your FREE copy of The Financial Crisis “Round Two” Survival Kit, today at: http://www.gainspainscapital.com/MARKETING/roundtwo.html
Graham Summers: Graham is Senior Market Strategist at OmniSans Research. He is co-editor of Gain, Pains, and Capital, OmniSans Research’s FREE daily e-letter covering the equity, commodity, currency, and real estate markets.
Graham also writes Private Wealth Advisory, a monthly investment advisory focusing on the most lucrative investment opportunities the financial markets have to offer. Graham understands the big picture from both a macro-economic and capital in/outflow perspective. He translates his understanding into finding trends and undervalued investment opportunities months before the markets catch on: the Private Wealth Advisory portfolio has outperformed the S&P 500 three of the last five years, including a 7% return in 2008 vs. a 37% loss for the S&P 500.
Previously, Graham worked as a Senior Financial Analyst covering global markets for several investment firms in the Mid-Atlantic region. He’s lived and performed research in Europe, Asia, the Middle East, and the United States.
© 2010 Copyright Graham Summers - All Rights Reserved
Disclaimer: The above is a matter of opinion provided for general information purposes only and is not intended as investment advice. Information and analysis above are derived from sources and utilising methods believed to be reliable, but we cannot accept responsibility for any losses you may incur as a result of this analysis. Individuals should consult with their personal financial advisors.
Graham Summers Archive |
© 2005-2022 http://www.MarketOracle.co.uk - The Market Oracle is a FREE Daily Financial Markets Analysis & Forecasting online publication.


