


Some Mining Stocks Analysis Using the True Strength Index Indicator
Companies / Company Chart Analysis Jun 13, 2010 - 09:22 PM GMTBy: John_Townsend

 Are you interested in discovering a new technical tool to use in your analysis of mining stocks? If so, this article may not only interest you, it may also help you make better trading decisions.
I hope you are familiar with the charting capabilities offered at www.FreeStockCharts.com. If not, you really owe it to yourself to explore this incredibly rich source of online and real-time charts, portfolio management and company specific news.
The main reason I visit this site is that they have my favorite indicator, the True Strength Index. You can select this indicator from a menu of indicators, display it in a lower panel below price, change its colors and parameters, as well as add an indicator to this indicator. This added capability is nice because I add a moving average to the indicator as I will show you soon.
The True Strength Index, called TSI for short, is a sophisticated and extremely responsive momentum indicator with very low lag time to response. The indicator was invented by William Blau and designed to give a couple of important interpretive certainties to its user. Namely, when the indicator is rising above ZERO, price is always rising. And, when the indicator is falling below ZERO, price is always falling.
Here is an hourly chart of recent SWC price action that I made at www.FreeStockCharts.com. In the lower panel are two lines. The True Strength Index (TSI) line is the rose colored line. The blue line is a 3 period moving average of the TSI line itself.
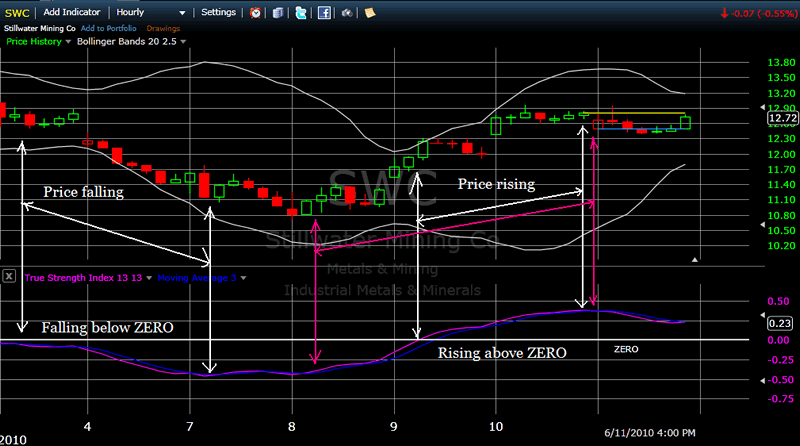
On this chart we note that the True Strength Index indicator began falling below ZERO on June 3 and bottomed a couple hours into June 7. And, price correspondingly dropped from around $12.48 to $11.40.
The white arrows on the right side of the chart pinpoint the area where the indicator was rising above ZERO. This began a couple hours into June 9 and peaked near the close on the following day. Price during this period rose from $12.30 to $12.80, or so.
Very observant readers have already figured out how a skilled trader could use the rose colored line as it crossed above the blue line early June 8th. It generated a buy signal much sooner that waiting for the ZERO crossover, and also did a perfect job of crossing back under the TSI when it was most profitable to close the trade at the close on June 10.
Using the signal given by the crossover of the indicator with the moving average, one could have bought SWC for $11.40 on June 8 and sold for $12.80……holding the trade 3 days.
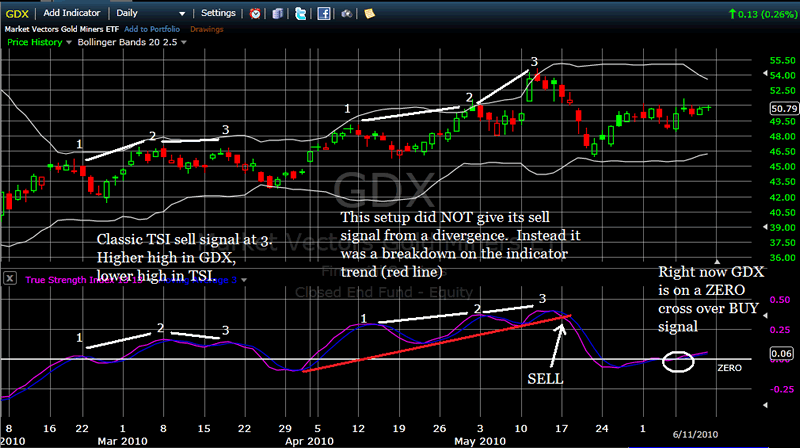
Next I would like to introduce a couple of other ways to interpret the TSI. The following daily chart of GDX provides our examples.
First, an effective interpretative tool is to look for divergences with respect to the indicator and price movement. By this I mean, look for an occasion of price making a higher high while the TSI indicator (above ZERO) makes a lower high. Conversely, look for a setup where the TSI indicator makes a higher low (while below ZERO) while price makes a lower low.
Second, a breakdown of a strong trend in the indicator is a sure sign to act, as this chart also shows.
To be clear, there are three different methods that the TSI can be used to render buy and sell decisions. It is a matter of personal preference, intuition with the current market dynamics that will determine which of the three you chose to use and in what circumstance.
A quick review of the BUY signals:
- TSI crosses above ZERO
- TSI crosses above moving average
- TSI makes higher low (below ZERO) while price makes a lower low
And the SELL signals:
- TSI crosses below ZERO
- TSI crosses below moving average
- TSI makes a lower high (above ZERO) while price makes a higher high
- Trend of TSI breaks down
I saved the bad news for near the end of this article. And it is this: nothing, and I mean nothing, works all the time. No indicator on earth works all the time. Even TSI.
Now I feel much better that I have told you the rest of the truth.
Seriously though, this is a great indicator and once you understand how to use it, it should help your buy and sell decisions significantly.
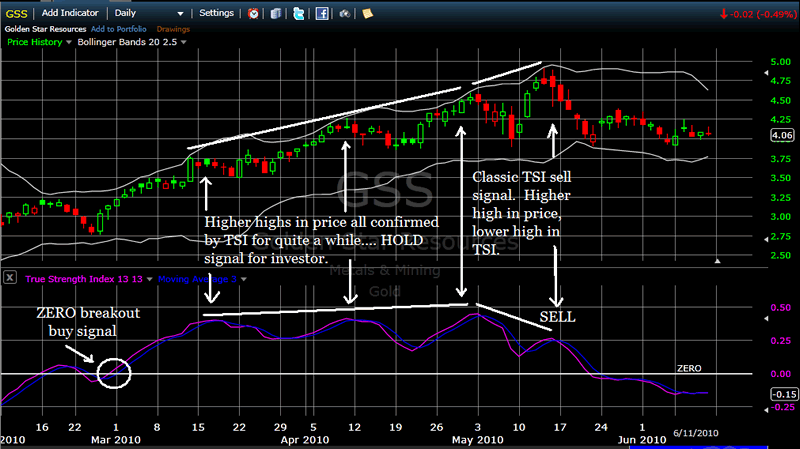
One last chart. This one is a daily of GSS. The TSI gave the ZERO crossover buy signal on March 1 at a price of about $3. The rally continued for quite some time – confirmed by higher highs in the TSI with each higher high in GSS price until price reached $4.75 on May 15. At that point, GSS had made a new high but the TSI did not. And that correctly gave the SELL signal.
I hope the True Strength Index indicator has captured your attention and curiosity. That was the point of this article J I have a website where I post mining stock charts with my True Strength Index analysis and pointers. I invite you to visit and to contribute both questions and analysis. The address is: http://www.theTSItrader.blogspot.com
I wish you profitable trading,
John Townsend
mailto:TSItrader@gmail.com
© 2010 Copyright John Townsend - All Rights Reserved
Disclaimer: The above is a matter of opinion provided for general information purposes only and is not intended as investment advice. Information and analysis above are derived from sources and utilising methods believed to be reliable, but we cannot accept responsibility for any losses you may incur as a result of this analysis. Individuals should consult with their personal financial advisors.
© 2005-2022 http://www.MarketOracle.co.uk - The Market Oracle is a FREE Daily Financial Markets Analysis & Forecasting online publication.