Crude Oil Stocks Sector Buy Signal
Commodities / Oil Companies Jun 12, 2010 - 06:59 PM GMTBy: DailyWealth
 It's time to lean over and pick up the cash... again.
The last time this happened, I gave my Advanced Income readers three trades. We earned 25%, 27%, and 30% in just one week.
It was March 16, 2009. Stocks were suffering from a vicious selloff. Every sector was getting hammered. And the oil stocks were especially weak.
Investors were stampeding away from the market. They were leaving a trail of crumpled value stocks in their wake. And they were willing to pay huge premiums to gain any sort of protection from further downside risk.
Profiting from selling options at that time was as easy as leaning over and picking up a pile of cash. So that's what we did.
We took advantage of the fear in the market and a "buy signal" from one of my favorite technical indicators. We sold expensive options on three stocks in the oil sector, immediately generating high income. And we closed out the trades one week later for large gains.
Get ready for these same kinds of gains today.
Stocks are getting crushed right now. Investors are stampeding away from the market. Option premiums are enormous. And we just got a buy signal from my favorite oil-sector trading indicator.
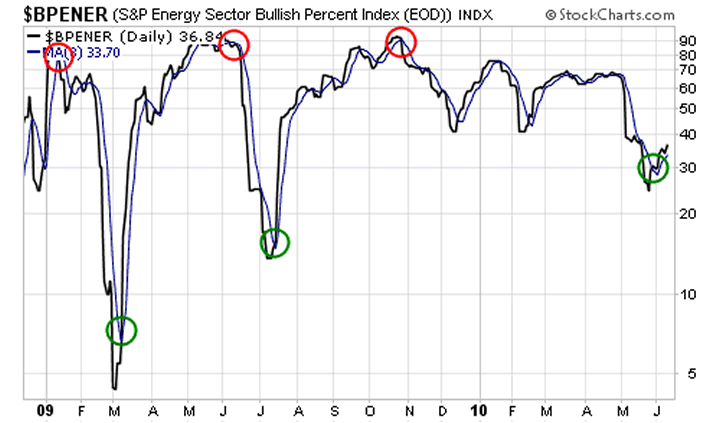
A bullish percent index (BPI) measures the percentage of stocks in a sector trading with bullish patterns. It works best to define overbought and oversold conditions, and to indicate when a sector is vulnerable to a reversal.
For example, in the oil sector, the bullish percent index is overbought when it rallies above 80 (meaning 80% of the stocks in the sector are in a bullish formation). The sector is oversold when the BPI drops below 30 (meaning only 30% of the stocks in the sector are in a bullish formation). Take a look at the chart...

Sell signals, highlighted by the red circles, occur when the energy sector's BPI rallies above 80 and then turns down and crosses below its eight-day exponential moving average (the "EMA" is the blue line on the chart above). Buy signals (green circles) occur when the BPI drops below 30 and then turns up and crosses over the eight-day EMA.
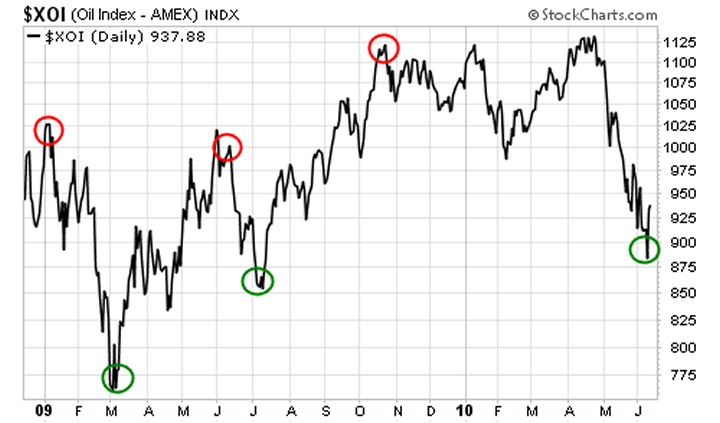
Now here's a chart of the AMEX Oil Index (XOI) with circles indicating the timing of the BPI trading signals...

Not a bad track record. Selling or shorting oil stocks on the red circles and buying them on the green circles was profitable for each of the past five signals.
The oil sector BPI just flashed another buy signal. It's time to buy some oil stocks.
I know what you're thinking... The stock market looks horrible. Europe is on the verge of an economic collapse. Oil is spewing into the Gulf of Mexico. And everybody else is telling you to run for cover.
That's not too different than what we were facing in March 2009. Back then, we took advantage of the situation by putting on a few trades in the oil sector. All of them generated big profits, fast.
There's nothing like a quick market decline to turn a speculative stock into a value play. Stocks that were too expensive and too risky to recommend a couple months ago are downright cheap today. And the premiums we can get from selling covered calls are large enough to offset most, if not all, of any remaining downside risk.
Even though the market is in turmoil and it feels like the risk is high, buying beaten-down oil stocks and selling covered calls against them today is far safer than it has been for most of the past year.
These setups don't come along every day. Take advantage of this one while you can. All you have to do is lean over and pick up the cash.
Good investing,
Jeff Clark
Editor's note: The opportunity to collect big income from safe stocks has rarely been better than it is right now. And if you're not familiar with how to write covered calls – it's more than worth your time to learn how. There's nobody better at using this strategy to generate income than Jeff Clark. You can learn more about his strategy – and how to come on board as an Advanced Income reader at a big discount – by clicking here.
The DailyWealth Investment Philosophy: In a nutshell, my investment philosophy is this: Buy things of extraordinary value at a time when nobody else wants them. Then sell when people are willing to pay any price. You see, at DailyWealth, we believe most investors take way too much risk. Our mission is to show you how to avoid risky investments, and how to avoid what the average investor is doing. I believe that you can make a lot of money – and do it safely – by simply doing the opposite of what is most popular.
Customer Service: 1-888-261-2693 – Copyright 2010 Stansberry & Associates Investment Research. All Rights Reserved. Protected by copyright laws of the United States and international treaties. This e-letter may only be used pursuant to the subscription agreement and any reproduction, copying, or redistribution (electronic or otherwise, including on the world wide web), in whole or in part, is strictly prohibited without the express written permission of Stansberry & Associates Investment Research, LLC. 1217 Saint Paul Street, Baltimore MD 21202
Disclaimer: The above is a matter of opinion provided for general information purposes only and is not intended as investment advice. Information and analysis above are derived from sources and utilising methods believed to be reliable, but we cannot accept responsibility for any losses you may incur as a result of this analysis. Individuals should consult with their personal financial advisors.
Daily Wealth Archive |
© 2005-2022 http://www.MarketOracle.co.uk - The Market Oracle is a FREE Daily Financial Markets Analysis & Forecasting online publication.


