Glittering Gold Emerges from Bullish Coil Pattern
Commodities / Gold & Silver Sep 05, 2007 - 12:35 AM GMTBy: Mike_Paulenoff
There are multiple reasons why gold and its ETF, the streetTRACKS Gold Shares (NYSE: GLD), could be emerging (finally) from a 15 month sideways bullish coil pattern.
To start, the GLD has been in a powerful bull trend since its Feb. '04 low at 41.00. In addition, the dollar has been relatively weak recently, and has been in a powerful stair-step downtrend versus the euro since Nov. 2005 (1.1640), which is a very supportive underlying factor for gold.
Further, the U.S. economy might be in a very vulnerable position in the aftermath of the housing and credit crises, which likely will require the Fed to lower rates to avoid the onset of recession-- during a period of rising commodity prices (energy and agriculture). Such a situation is bullish for gold, at least initially.
And finally confrontation rhetoric is heating up again between Iran and the Bush Administration concerning Iran's nuclear capability, and that country's alleged intervention in Iraq. The President of Iran appears to be playing a dangerous game of "I dare you" with the Bush Administration, which is approaching its final 16 months in office. President Bush has vowed that before he leaves the White House, he will make sure that his successor does not inherit the problems he has created in the Mid-East. If the President means what he says, then we might infer that he plans to "finish the job (whatever that entails)," and clean up his own "mess" before Jan. 2009. This "game" of brinksmanship between Iran and the U.S. could move both nations towards military confrontation sooner rather than later-- a situation that would attract investors to gold.

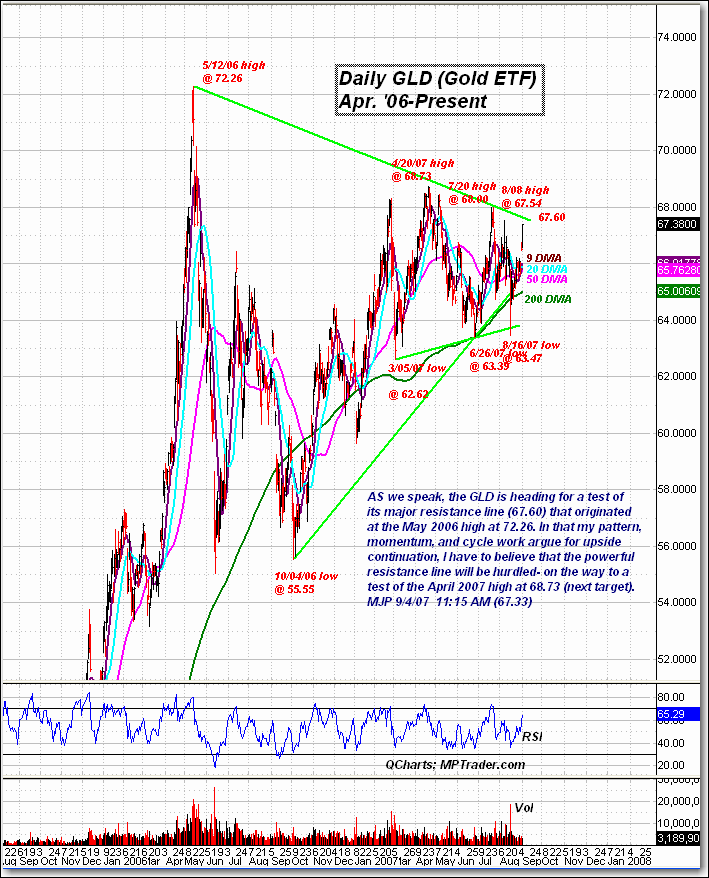
Technically, as you'll see from this morning's daily chart, spot gold appears to be heading for a confrontation with $700. The GLD was heading for a test of its major resistance line (67.60) that originated at the May 2006 high at 72.26.
In that my pattern, momentum and cycle work argue for upside continuation, I have to believe that the powerful resistance line with be hurdled on the way to a test of the April 2007 high at 68.73, our next target.
Sign up for a free 15-day trial to Mike's ETF Trading Diary today.
By Mike Paulenoff
Mike Paulenoff is author of the MPTrader.com (www.mptrader.com) , a real-time diary of Mike Paulenoff's trading ideas and technical chart analysis of Exchange Traded Funds (ETFs) that track equity indices, metals, energy commodities, currencies, Treasuries, and other markets. It is for traders with a 3-30 day time horizon, who use the service for guidance on both specific trades as well as general market direction
© 2002-2007 MPTrader.com, an AdviceTrade publication. All rights reserved. Any publication, distribution, retransmission or reproduction of information or data contained on this Web site without written consent from MPTrader is prohibited. See our disclaimer.
Mike Paulenoff Archive |
© 2005-2022 http://www.MarketOracle.co.uk - The Market Oracle is a FREE Daily Financial Markets Analysis & Forecasting online publication.


