


Stock Market On the Edge of Something Very Big, Crash?
Stock-Markets / Financial Markets 2010 Jun 09, 2010 - 07:02 PM GMT

 U.S. stocks lost their gains Wednesday as Federal Reserve Chairman Ben Bernanke voiced
cautious optimism about the economy and the central bank's Beige Book also noted modest
improvement.
U.S. stocks lost their gains Wednesday as Federal Reserve Chairman Ben Bernanke voiced
cautious optimism about the economy and the central bank's Beige Book also noted modest
improvement.
"Everything is universally moving in the right direction, but we already knew that," said Jeffrey Kleintop, chief market strategist at LPL Financial of the Fed's June report, which noted improvement across all 12 districts.
Backlash at BP
The cost to protect BP Plc’s bonds against default soared to a record, more than nine times the level before one of its wells exploded in the Gulf of Mexico, as pressure on the company to suspend its dividend intensified.
Credit-default swaps on BP climbed 126.1 basis points to 386.9 basis points, according to CMA DataVision prices. More than 40 U.S. lawmakers called today for the London-based company to suspend its dividend and Interior Secretary Ken Salazar told a Senate committee that “significant additional” safety requirements will be imposed on oil and gas companies drilling in the Gulf.
Why Did The U.S. Refuse International Help on The Gulf Oil Spill?
(ZeroHedge) Despite the vow by President Obama to keep the Gulf oil spill a top priority until the damage is cleaned up, 50 days after the BP rig exploded, a definitive date and meaningful solution is yet to be determined for the worst oil spill in the U.S. history.
So, you would think if someone is willing to handle the clean-up with equipment and technology not available in the U.S., and finishes the job in shorter time than the current estimate, the U.S. should jump on the offer. But it turned out to be quite the opposite.
The VIX tested intermediate-term Support.
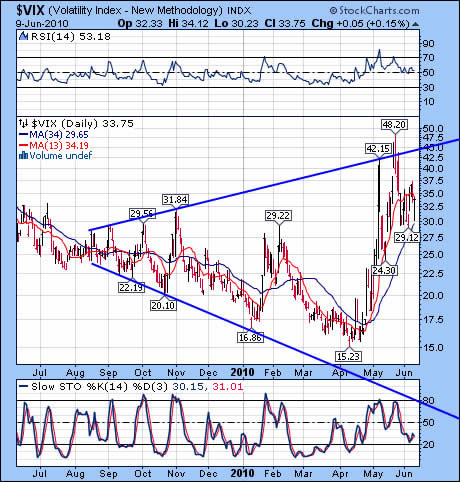 -- All of the see-sawing in the VIX
confirms the uptrend, even though it
closed below short-term Trend
Support at 34.19 today. The rally in
stocks that completed today was at a
smaller-degree than the rally which
topped on May 12th. However, the
VIX is giving this pause in the
decline a higher-degree pullback.
This is something that I have only
observed for the first time, and
suggests a very strong move is about
to happen.
-- All of the see-sawing in the VIX
confirms the uptrend, even though it
closed below short-term Trend
Support at 34.19 today. The rally in
stocks that completed today was at a
smaller-degree than the rally which
topped on May 12th. However, the
VIX is giving this pause in the
decline a higher-degree pullback.
This is something that I have only
observed for the first time, and
suggests a very strong move is about
to happen.
The CBOE Put-Call Ratio for equities ($CPCE) stayed neutral at .92 today. The pros have increased the $CPCI to 1.62 (more bearish) at the end of the day. The 10-day average is still 1.52. The NYSE Hi- Lo index closed down 32 points today to -108. The Hi-Lo index remains in bearish territory. Bullish territory starts at 95.
SPY retested short-term Resistance.
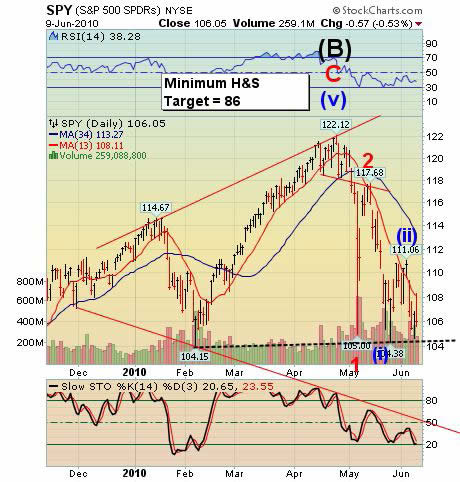 Action: Sell/Short/Inverse
-- The saying goes, “The markets
always rally before a crash.” SPY is
no different as it approaches the
Head and Shoulders Neckline
illustrated in the chart. This will be
the third attempt to break 104 since
the Flash Crash in May. It may just
be the charm.
Action: Sell/Short/Inverse
-- The saying goes, “The markets
always rally before a crash.” SPY is
no different as it approaches the
Head and Shoulders Neckline
illustrated in the chart. This will be
the third attempt to break 104 since
the Flash Crash in May. It may just
be the charm.
The probability of some event causing the market to gap through support overnight is very high. The H&S pattern sets up a target of 86.64, which is very close to the July 8 low of 85.77. My model suggests that we may see the markets meet their downside targets early next week.
QQQQ makes its lowest close since February.
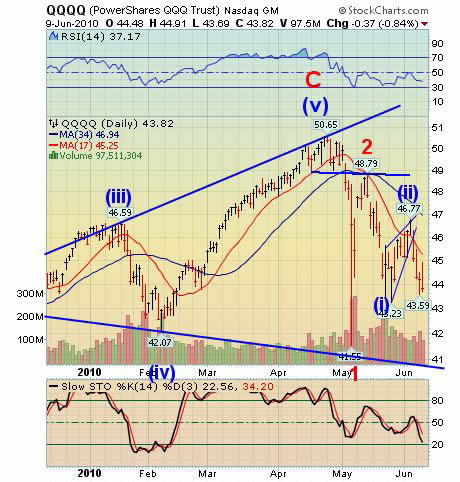 Action: Sell/Short/Inverse
-- QQQQ closed lower as it traces
out a complex Head & Shoulders
pattern with a neckline roughly
corresponding to the lower trendline
of the Broadening Top formation. It
appears that the very next target for
QQQQ will be the lower trendline of
the Broadening Top. However, I am
looking for a “normal” wave 3 that
may cut through the trendline on its
way to 37-38.00 or lower. A likely
target may be its (last) July low at
34.17.
Action: Sell/Short/Inverse
-- QQQQ closed lower as it traces
out a complex Head & Shoulders
pattern with a neckline roughly
corresponding to the lower trendline
of the Broadening Top formation. It
appears that the very next target for
QQQQ will be the lower trendline of
the Broadening Top. However, I am
looking for a “normal” wave 3 that
may cut through the trendline on its
way to 37-38.00 or lower. A likely
target may be its (last) July low at
34.17.
XLF is prepared to plunge through its neckline.
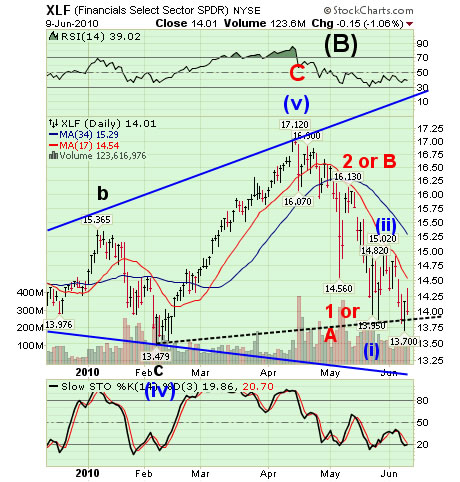 Action: Sell/Short/Inverse
-- XLF now appears ready to drop
below the Head & Shoulders
neckline which gives us a target of
10.50 – 11.00. Head & Shoulders
patterns work best at the beginning
of a third wave, which describes the
situation perfectly. The July, 2009
low was 10.73, which is the next
support level.
Action: Sell/Short/Inverse
-- XLF now appears ready to drop
below the Head & Shoulders
neckline which gives us a target of
10.50 – 11.00. Head & Shoulders
patterns work best at the beginning
of a third wave, which describes the
situation perfectly. The July, 2009
low was 10.73, which is the next
support level.
The brief spike to 14.37 this morning before XLF turned back down played out as expected. We are now starting the most powerful move of the series today.
FXI appears ready to cross intermediate resistance.
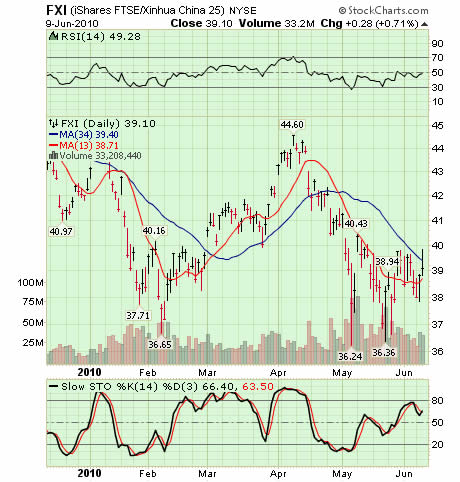 Action: Buy/Long
-- FXI rallied briefly above
intermediate-term Trend Support at
39.40 today. It also had an upside
breakout, even though it settled
below Trend Support at the close.
This is very bullish action and should
be encouraging for those who have
doubted the upside reversal until
now.
Action: Buy/Long
-- FXI rallied briefly above
intermediate-term Trend Support at
39.40 today. It also had an upside
breakout, even though it settled
below Trend Support at the close.
This is very bullish action and should
be encouraging for those who have
doubted the upside reversal until
now.
$SSEC made a pretty substantial move today, as well, closing just below short-term Trend Resistance at 2590.
GLD stumbled, but maintained its uptrend.
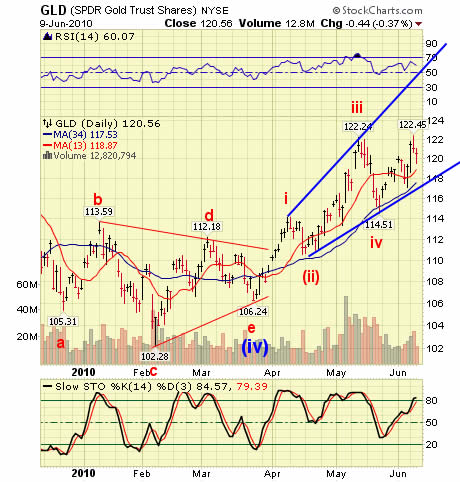 Action: Maintain Longs, looking for
an exit
-- GLD stumbled after its breakout,
but is still advancing in a “wave c” of
a probable final zig-zag on its way to
my model target of 126.00.
Action: Maintain Longs, looking for
an exit
-- GLD stumbled after its breakout,
but is still advancing in a “wave c” of
a probable final zig-zag on its way to
my model target of 126.00.
Yesterday’s breakout is still being tested, but a more convincing emergence above 122.24 should bring the buyers back. It is doubtful that the volume will increase appreciably, however, since it will be the retail buyers pushing up the final spike in price. GLD is already in nosebleed territory, so it may not be wise to stay too long. I will keep you posted if a reversal pattern emerges.
USO is completing a wave (ii).
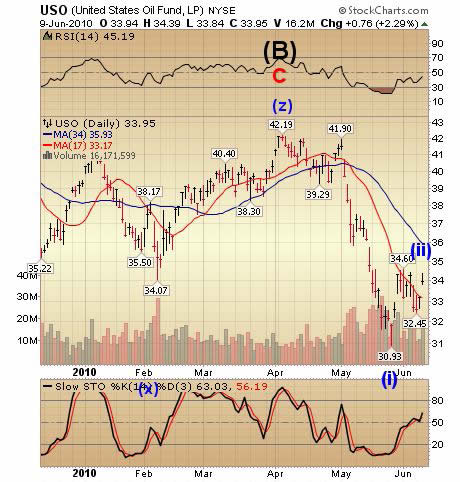 Action: Sell/Short/Inverse
-- Today’s rally in USO cleared
up the wave pattern as it spiked
toward intermediate-term Trend
Resistance at 35.93. This has two
implications. First, it may spike even
higher as it completes a higher
degree (to 35.93, perhaps?) second
wave. Second, wave (iii) may take
USO below 18.00 in wave (iii).
There is no “alternate count” in USO
at this time.
Action: Sell/Short/Inverse
-- Today’s rally in USO cleared
up the wave pattern as it spiked
toward intermediate-term Trend
Resistance at 35.93. This has two
implications. First, it may spike even
higher as it completes a higher
degree (to 35.93, perhaps?) second
wave. Second, wave (iii) may take
USO below 18.00 in wave (iii).
There is no “alternate count” in USO
at this time.
TLT has finished a pullback to short-term support.
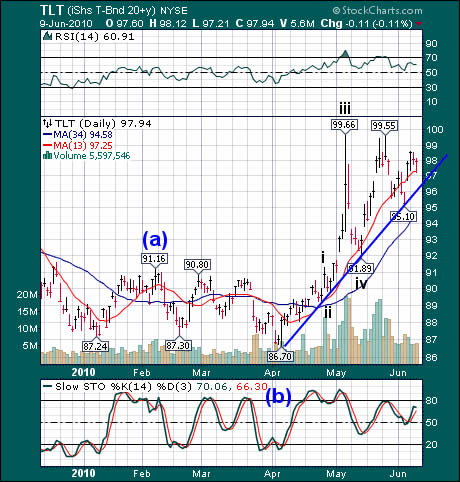 Action: Maintain Longs, Look for
an exit early next week.
-- TLT found support at the shortterm
Trend Support at 97.25. It
appears that the next rally attempt
should break above the prior highs
and potentially target the 103.00
area. Once that target is reached, it
may be advisable to start taking
profits, unless you can watch the
pattern like a hawk.
Action: Maintain Longs, Look for
an exit early next week.
-- TLT found support at the shortterm
Trend Support at 97.25. It
appears that the next rally attempt
should break above the prior highs
and potentially target the 103.00
area. Once that target is reached, it
may be advisable to start taking
profits, unless you can watch the
pattern like a hawk.
The U.S. is now one of the top 5 sovereign deriskers as CDS activities are picking up. This does not bode well for our bond market. The perceived risk of default is now rising.
UUP also finds support at the 13-day moving average.
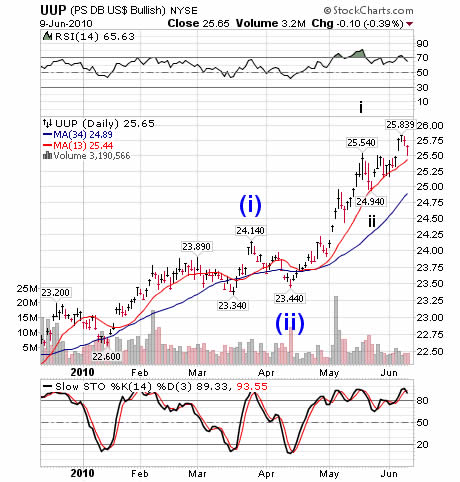 Action: Buy/Long
-- UUP pulled back to its short -term
Trend Support at 25.44 instead of
accelerating as I had expected.
Nothing has changed, though. Wave
iii of (iii) could go substantially
higher, targeting somewhere above
28.00 in the move immediately
before us.
Action: Buy/Long
-- UUP pulled back to its short -term
Trend Support at 25.44 instead of
accelerating as I had expected.
Nothing has changed, though. Wave
iii of (iii) could go substantially
higher, targeting somewhere above
28.00 in the move immediately
before us.
Tomorrow the pivot window for UUP opens, so we may see fireworks starting in the next move higher.
Have a great evening!
Tony
Traders alert: The Practical Investor is currently offering the daily Inner Circle Newsletter to new subscribers. Contact us at tpi@thepracticalinvestor.com for a free sample newsletter and subscription information.
Our Investment Advisor Registration is on the Web
We are in the process of updating our website at www.thepracticalinvestor.com to have more information on our services. Log on and click on Advisor Registration to get more details.
If you are a client or wish to become one, please make an appointment to discuss our investment strategies by calling Connie or Tony at (517) 699-1554, ext 10 or 11. Or e-mail us at tpi@thepracticalinvestor.com .
Anthony M. Cherniawski, President and CIO http://www.thepracticalinvestor.com
As a State Registered Investment Advisor, The Practical Investor (TPI) manages private client investment portfolios using a proprietary investment strategy created by Chief Investment Officer Tony Cherniawski. Throughout 2000-01, when many investors felt the pain of double digit market losses, TPI successfully navigated the choppy investment waters, creating a profit for our private investment clients. With a focus on preserving assets and capitalizing on opportunities, TPI clients benefited greatly from the TPI strategies, allowing them to stay on track with their life goals
Disclaimer: The content in this article is written for educational and informational purposes only. There is no offer or recommendation to buy or sell any security and no information contained here should be interpreted or construed as investment advice. Do you own due diligence as the information in this article is the opinion of Anthony M. Cherniawski and subject to change without notice.
Anthony M. Cherniawski Archive |
© 2005-2022 http://www.MarketOracle.co.uk - The Market Oracle is a FREE Daily Financial Markets Analysis & Forecasting online publication.