Another Warning Bell Rings for the Stock Market
Stock-Markets / Stocks Bear Market Jun 09, 2010 - 08:36 AM GMTBy: Claus_Vogt
 A short four weeks ago, the stock market impressed us with what was later dubbed a flash crash — a sudden 1,000 point plunge in the Dow Industrial Average, followed by an equally fast retracement of half the decline. Impressive, indeed, but also an important technical sign.
My interpretation of that episode is that it was a typical warning crack …
A warning crack appears at the end of a bull market’s move. It’s a sign that the character of the market has changed; that the topping process has started. It’s like ringing a bell, a harbinger of what the future holds. And the severity of this particular warning crack is a sign of the severity of the bear market ahead.
Then last Friday, another warning bell sounded …
On the surface, Friday’s 323 point loss for the Dow was not that impressive. We’ve seen much larger drops in past years, especially in 2008. But beneath the surface, this decline was very impressive, making it one of the outstanding events of the last 50 years.
You see, the stock market is much than the major indexes are mirroring. It’s also …
 |
| Market breadth measures the number of stocks rising and falling. |
A Market of Stocks
There are technical indicators based on this reality. These are found by using market breadth data — the number of rising and falling stocks and the respective volume figures.
The Arms Index is one of those breadth-based indicators. It’s calculated with the following formula:
_(advancing stocks/declining stocks)_ (volume of advancing stocks/ volume of declining stocks)
This helps me look beneath the market’s surface: A ratio of 1 means the market is in balance. Higher than 1 tells me that more volume is moving into declining stocks. And lower than 1 means more volume is moving into advancing stocks.
During bull markets, the Arms Index rises above 3 every now and then. That usually indicates the end of a correction and thus a buying opportunity.
In bear markets, defined as markets with falling 200-day moving averages, an Arms Index above 3 still signals oversold market conditions. But the buying opportunity is often just a short-term one and much less reliable than in bull markets.
The History of Double-Digit Arms Index Readings …
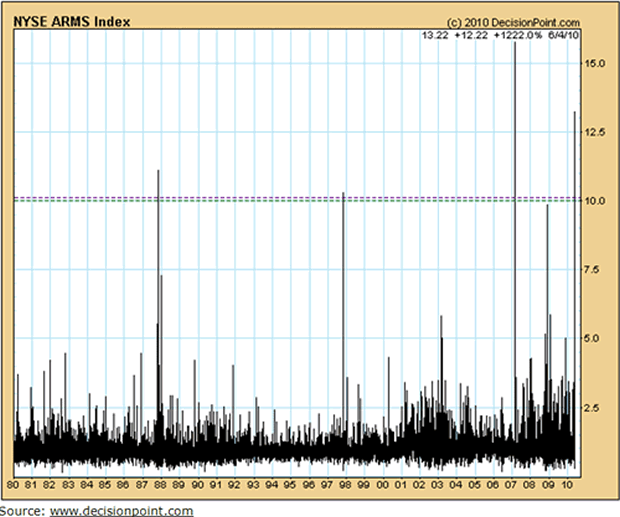
The chart below shows you the history of the Arms Index since 1980.

During this 30-year span (it’s also true going back 50 years) the Arms Index rose into double-digit territory only four times:
- October 19, 1987, Black Monday, the day the Dow plunged over 22 percent in one of the most infamous stock market crashes in history.
- October 27, 1997, which turned out to be the stock market’s low during the Asian financial crisis.
- February 27, 2007, this marked the low of a short, but hefty correction.
- June, 4, 2010, last Friday.
The first three instances turned out to be either outstanding or — in the case of 2007 — good buying opportunities. So does Friday’s reading of 13.22 signal another buying opportunity?
A Major Difference in the Big Picture
 |
| Friday’s high Arms Index reading indicates the next move is bound to be bearish. |
Let’s first address the major difference between 1987 and 1997 on the one hand and 2007 and 2010 on the other …
The first two instances happened during a long-term bull market that began in 1982 and lasted until 2000. Both signaled longer-term buying opportunities.
The latter two took place during a long-term bear market that began in 2000 and will probably last a few more years. The one in 2007 signaled a short-term opportunity. And that’s exactly what I expect from the most recent occurrence. It’s marking only a short-term low.
In the bigger picture, last Friday’s stumble serves as another warning sign that the next major market move will be a severe bear market. A bear market as severe as or even worse than the 2007-2009 bear market, which was heralded by the record-breaking Arms Index reading in February 2007.
Keep in mind, though, that like all technical indicators, the Arms Index is not infallible. It has to be interpreted in the context of the bigger picture. And as you have just seen, this bigger picture is unequivocally bearish.
Best wishes,
Claus
This investment news is brought to you by Money and Markets. Money and Markets is a free daily investment newsletter from Martin D. Weiss and Weiss Research analysts offering the latest investing news and financial insights for the stock market, including tips and advice on investing in gold, energy and oil. Dr. Weiss is a leader in the fields of investing, interest rates, financial safety and economic forecasting. To view archives or subscribe, visit http://www.moneyandmarkets.com.
© 2005-2022 http://www.MarketOracle.co.uk - The Market Oracle is a FREE Daily Financial Markets Analysis & Forecasting online publication.
Comments
|
Liam
10 Jun 10, 00:04 |
bear repeating
you said the same on Feb 3rd when stocks bottomed, a great contrary indicator http://www.marketoracle.co.uk/Article16979.html |


