Stocks Bull and Bear Market Simple Indicator
Stock-Markets / Stock Markets 2010 Jun 09, 2010 - 06:36 AM GMTBy: DailyWealth
 Dr. Steve Sjuggerud writes: I don't know why everyone doesn't get it.
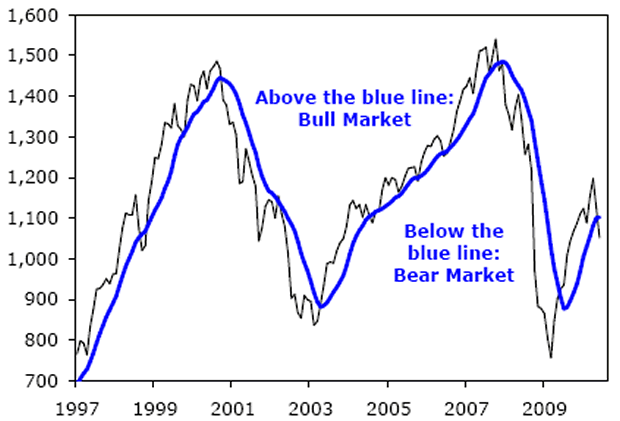
Let's see if you do: When the stocks are above the blue line, it's a bull market, and you want to own stocks. When stocks are below the blue line, it's a bear market.
Is that hard to get? Take a look:

If you'd followed an investment strategy based on this simple idea, your portfolio would have beaten the best fund managers in the world. Even better, it would have taken you only two hours a year to follow (just 10 minutes a month).
Since the start of that chart above, the main stock market index (the S&P 500) has risen 4% per year. If you'd bought when the stock market was below the blue line, you'd have lost money at a rate of over 11% per year. If you'd bought when the stock market was above the blue line, you'd have made a 12% profit per year – not including dividends.
Since bull markets are longer than bear markets, you'd be "in" about two-thirds of the time and "out" one-third of the time.
This little system works even if you look further back...
I ran the numbers going back to the early 1970s. And the results are similar... Stocks rise 12% a year when they're above the blue line. And you lose money when stocks are below the line. Also, similarly, you're "in" stocks about two thirds of the time. So the strategy has worked for 40 years... at least.
This "blue line strategy" is nothing fancy by the way...
It's the 10-month moving average of the S&P 500 index. You just take the closing prices of the stock market at the end of the each of the last 10 months and average them. If the current price is above the average, you buy. If it is below the average, you step aside.
There's nothing special about the 10-month average. This system works with the eight-month average, nine-month average, 11-month average... whatever. It's not far off from the 40-week average or the 200-day average. These are typical things that traders look at.
My point is, I'm not doing some sort of mathematical gymnastics. It is simple.
I'm bringing this little strategy up today because important things are happening with it right now...
For the last year, stocks have been above the blue line. We've been in a bull market. But that appears to be ending right now. If June ended today (as I assumed in the chart above), the stock market would be below the line... and it would be time to be "out."
The great thing about this strategy is the blue line doesn't care about housing bubbles, wars, dot-com booms and busts, or government spending. The blue line does no analysis at all.
With the blue line strategy, you spend two hours a year (10 minutes a month to calculate the average), and you beat the stuffing out of the best fund managers in the world.
The blue line strategy has only issued two recommendations since late 2006... It said "sell" stocks back in 2007. And it said "buy" in mid-2009.
Don't you wish you would have ignored everyone and everything else in that time and simply gone with the blue line strategy?
After a year of saying "buy stocks" if things stay as they are, the blue line strategy looks like at the end of this month it could be issuing its first "sell" recommendation since 2007. The blue line strategy has a great track record... What are you gonna do?
P.S. The originator of this strategy is Mebane Faber (www.mebanefaber.com). He's built an incredible strategy using it... See www.theivyportfolio.com for the details.
The DailyWealth Investment Philosophy: In a nutshell, my investment philosophy is this: Buy things of extraordinary value at a time when nobody else wants them. Then sell when people are willing to pay any price. You see, at DailyWealth, we believe most investors take way too much risk. Our mission is to show you how to avoid risky investments, and how to avoid what the average investor is doing. I believe that you can make a lot of money – and do it safely – by simply doing the opposite of what is most popular.
Customer Service: 1-888-261-2693 – Copyright 2010 Stansberry & Associates Investment Research. All Rights Reserved. Protected by copyright laws of the United States and international treaties. This e-letter may only be used pursuant to the subscription agreement and any reproduction, copying, or redistribution (electronic or otherwise, including on the world wide web), in whole or in part, is strictly prohibited without the express written permission of Stansberry & Associates Investment Research, LLC. 1217 Saint Paul Street, Baltimore MD 21202
Disclaimer: The above is a matter of opinion provided for general information purposes only and is not intended as investment advice. Information and analysis above are derived from sources and utilising methods believed to be reliable, but we cannot accept responsibility for any losses you may incur as a result of this analysis. Individuals should consult with their personal financial advisors.
Daily Wealth Archive |
© 2005-2022 http://www.MarketOracle.co.uk - The Market Oracle is a FREE Daily Financial Markets Analysis & Forecasting online publication.


