Sovereign Debt Concerns Continue to Hit Stocks and Commodity Markets
Stock-Markets / Financial Markets 2010 Jun 09, 2010 - 03:47 AM GMT Global Economy - Sovereign debt concerns hang above the market like the sword of Damocles, ready to exact its deadly toll. With complete disregard for the inherent power of public speaking, a Hungarian diplomat stated there was a good chance that Hungary will be the next Greece; and that Hungary may default on their sovereign debt.
Needless to say, this did not calm an already roiled market. The contemplation of defaulting on sovereign debt seems to be in vogue. This is a warning of things to come: whether true or not, just the fact it was said depicts a faulty mindset towards debt repayment. The population at large, including the business and financial community, has been misled to believe in Keynesian voodoo economics.
Another example of the fallout from growing sovereign debt concerns were comments out of Iran on their foreign currency holdings. Remember a few years ago when Iran was huffing and puffing that they were not going to accept U.S. dollars in payment for oil. They wanted either Euros or a new gold currency similar to the Dinar.
Now, Iran is selling a huge portion of their euro currency reverses for U.S. dollars, with a plan to reduce their holdings to 50% of what they presently are ($110 billion).
The Swiss announced that they will not defend the euro in the currency markets. This helped propel the euro below 120 for the first time since 2006. Look for on-going sovereign debt problems in the future, which will become as infamous as derivatives and structured finance.
This week's report focuses on the long term: what's likely coming down the road that will affect us all.
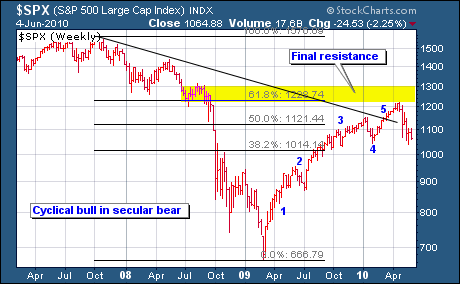
I have stated since this rally began that I believe it is either the fourth wave of a counter-trend bear market rally; or the fifth wave of a cyclical bull market within the confines of a longer term secular bear market.
Either way, the ending is the same: the mother of all bear markets - a secular bear predicated on too much debt and the collapse of paper fiat debt-money. It is different this time.
Here is a list of some events that are likely to occur:
- On-going battle between deflationary and inflationary forces
- Deflationary forces win out short term
- Hyperinflationary forces overcome long term
- Sovereign debt problems spread
- Rising interest rates - slowly at first, then quickening
- Asset bubbles in China, similar to Japan 20 years ago
- Restriction of credit in China
- Fall out in China same as Japan
- Asset bubbles in Brazil
- Asset bubbles in India
- India - inflation high (food)
- Central banks & governments inflate - wealth redistribution
- Global Asset inflation
- Further financial bailouts with our money
- Rising & unsustainable debt levels
- State, fed, & private pension fund problems
- No buyers for the toxic waste on the Fed's books
- Increasing supply of bonds in the market - pressure on rates
- Boom/bust cycles on a global scale
- Death of paper fiat debt-money
Please note: none of the above is meant as shock and awe or scare tactics. These are reasonable expectations in lieu of the current system of credit and debt that the world markets are based on.
These problems can be easily solved if those in high places want them to be solved. They cannot and will not be solved by more of the same: more credit, debt, and paper money heaped upon a raging fire.
- The system needs to be replaced - not fixed or papered over.
- We must spend less and save more.
- Our money's purchasing power must be sound and not continually eroding day by day.
- We cannot take on debt our children and their children will have to work to pay off.
It really is quite simple IF we want things to change; and we demand that our elected representatives change them according to the Constitution, the same Constitution they took an oath to protect and defend.
What better plan is there then that sacred document, which mandates gold and silver coin as legal tender; and no bills of credit (paper money)?
The writing is on the wall - it is best that we wake up and read the message and heed its warning, before it's too late.
The world is at a critical juncture, which way it goes from here will have repercussions well into the future. What is transpiring is of epoch proportions and will affect our children and their children to come.
Stocks
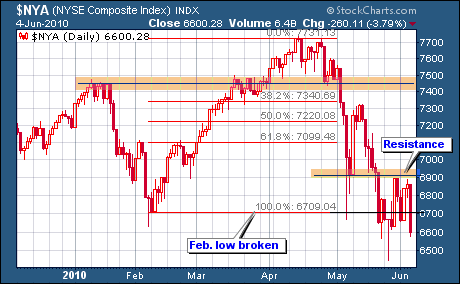
The first chart up is the daily NYSE Composite Index. I used a similar chart in last week's report, as this index covers the broader market (2000 stocks). The first thing to note is that the index broke below its Feb. low in late May; and on Friday (6/3) it made a lower low (6600.38).
On a closing basis, the index has made a lower low; however, on an intra-day basis it has not yet made a lower low. Personally, I think that closing prices are more important, and in my work that is what I concentrate on. A lower closing low has been made; and it is possible that more may follow.
Notice that according to the Fibonacci retracement levels overlaid on the chart from the Feb. low to the April high that the index has retraced or given back its entire rally since Feb.
This suggests that the move is not a correction of the prior uptrend, but a change in the direction of the trend until proven otherwise.
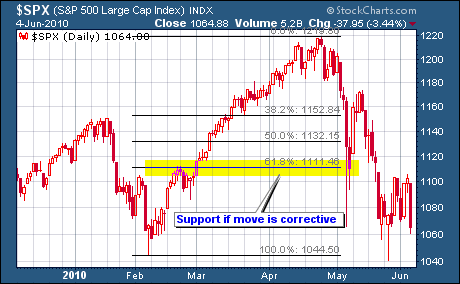
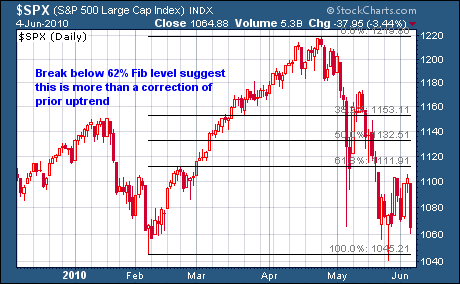
Below is a similar chart of the SPX. It shows the rally coming out of the Feb. low with the Fibonacci retracement levels overlaid.
Here, the Feb. low was broken below only once, and that was on an intra-day level, not on a closing basis, hence it carries less weight IMO.
Notice, however, that the index has retraced well beyond the 62% Fib retracement level.
This strongly suggests the move is not corrective, but is a change in the direction of the intermediate term trend.
However, this will not be confirmed until the market closes below the Feb. low on a 3 day or weekly closing basis.
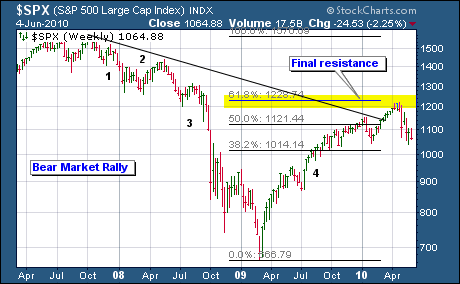
Above: a chart of the S&P that illustrates the present rally as the 4th wave (up) of a bear market counter trend rally. The fifth and final wave is to the downside. Below: a chart of the S&P that depicts the recent rally as a 5 wave cyclical bull market within a secular bear market. Either way the ending is the same: a secular bear market that moves to new lows.
Let's hone in on the daily S&P chart and its rise out of the Feb. 2010 low to the April high. Overlaid on the chart is a series of Fibonacci retracement levels.
As can be seen, the index has retraced essentially its entire rally off the lows. Any retracement beyond the 62% level usually indicates that the move is not a correction of the prior uptrend, but a change in the direction of the previous trend until proven otherwise.
However, the Feb. low must be broken below to confirm a change in the direction of the prior uptrend. This has not yet happened.
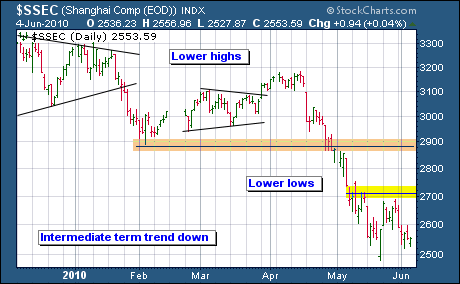
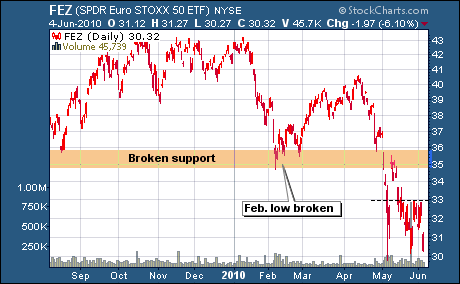
Above: China's market has already broken below the Feb. low and has confirmed a change in the direction of the intermediate term trend. Below: the Euro ETF has also broken below its Feb. low and has signaled a change in trend direction as well. Neither chart bodes well for the U.S. markets looking ahead.
Currencies (snippet from the full currency section)
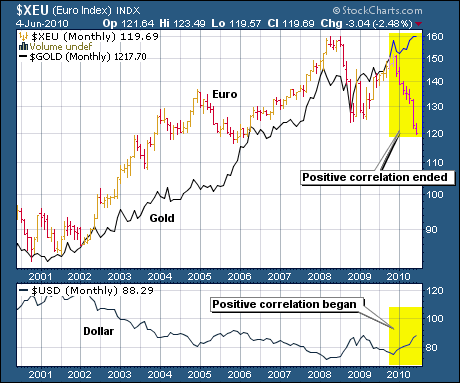
The euro has been and remains at the epicenter of the global markets. This week it hit its lowest level (119.69) since 2006. As we saw in the opening remarks, Iran is selling half of its euro currency reserves for U.S. dollars - a move that would have been considered heresy a few years ago. Clearly, the euro is out of favor.
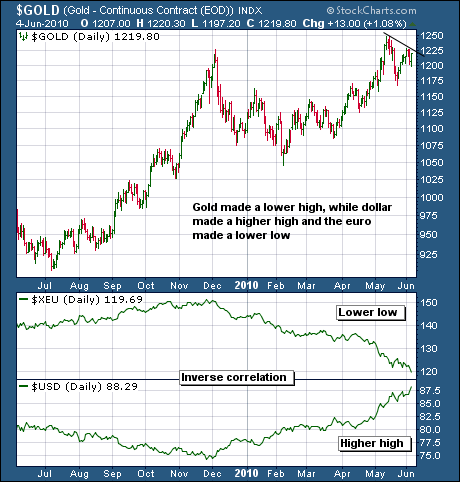
The chart below shows how the euro and gold tracked one another until Dec. 2009. Then all hell broke loose: the euro started falling and it hasn't stopped since, down about 20% from 150 to 120.
Gold parted company and continued higher, surging to an all-time high. At the bottom of the chart is the U.S. dollar. Since Dec. 2009, the dollar and gold have tracked in the same direction, while previously they had moved inversely to one another.
Commodities (a snippet from the full commodity section)
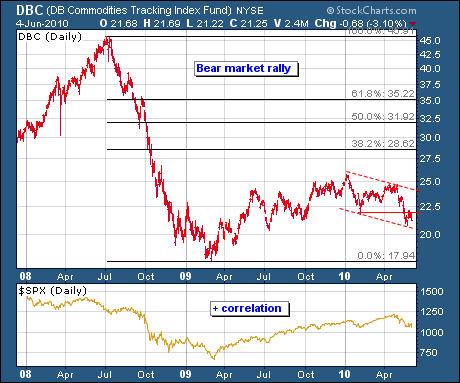
In the currency section we saw that the Canadian and Australian Dollars appear to be topping out. They are both currencies of major commodity exporting countries. As the following charts show, it looks like commodities may be topping out along with the "commodity" currencies.
The next chart shows the big hit commodities took in the 2008 decline, losing about 60%. Since bottoming early in 2009, the DBC has only rallied to a high of around 25, which is significantly below the first Fibonacci retracement level (38%) at 28.62.
Commodities have retraced around 25% of their 2008 decline, quite weak as far as corrective rallies go. Notice that the Feb. low has been broken below.
Until proven otherwise, this is a bear market counter trend rally.
Gold
The following is a small sample from the complete gold section of the weekly market report available to subscribers only. For a free trial subscription see the info at the end of the article.
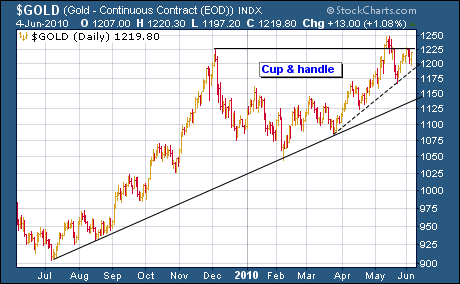
Let's start off with a simple chart of gold without any indicators or detailed analysis. The chart shows a cup & handle formation. The handle is presently under construction.
A break out above the rim (1225) that holds on a three day or weekly closing basis
Projects an upside target of $1400 (1225-1050=175+1225=1400).
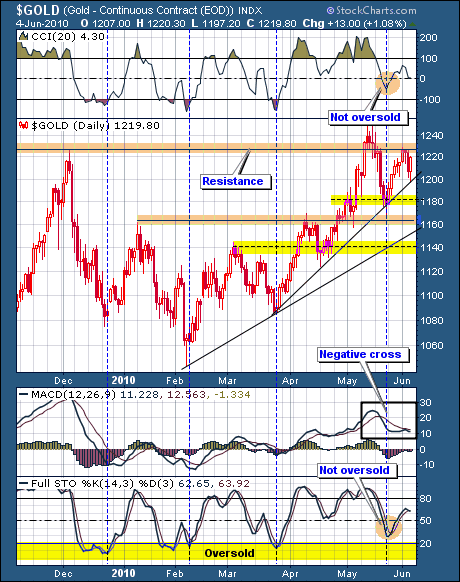
For the week gold gained $5.30 (0.44%) to close at $1219.80. Of interest to note: stocks fell 2%, bonds gained 1.68%, the dollar added 1.70%, and the euro was down 2.53%.
Gold did not rise commensurate with the declines in stocks and the euro; nor with the rise in the other safe haven plays: bonds and the dollar. There is no law that says it has to, but it is noted.
The daily chart has resistance near 1230, as indicated by the black horizontal line. Gold's lower diagonal trend line offers first support just below $1200.00. More significant support resides below at $1180.00.
MACD remains under a negative crossover - a positive crossover is needed.
Notice that both CCI & STO did not hit oversold levels on the recent pullback.
The vertical blue dotted lines show previous set-ups that signaled corrections: note: oversold levels were reached prior to all such corrections and that is not presently the case.
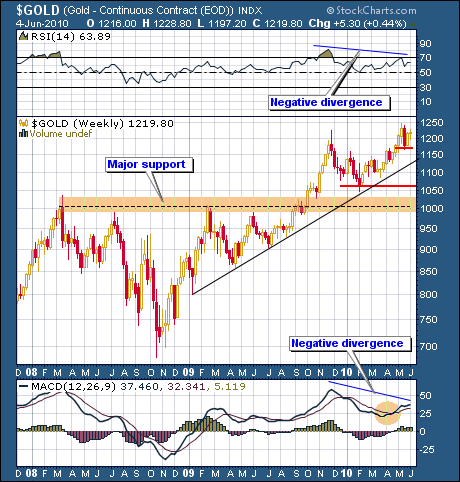
The weekly chart shows negative divergences in both RSI & MACD, which is still under a positive crossover. I mentioned these divergences last week, as well as the weekly candlesticks that were hinting that a short term reversal might be at hand.
First support is between 1160-1170, followed by trend line support around 1135 and lower horizontal support near 1060.00.
Gold remains the only bull market in town and has performed the best during the financial crisis and the recent mini-crisis, and for the last decade.
Until proven otherwise, gold is going much higher.
The question is whether gold will correct before moving up. When an asset is in a bull market, the best time to accumulate more of it is when it corrects and holds support.
Our model portfolio holds a significant allocation of gold and silver, as subscribers are aware of. As such, chasing higher prices is not needed. Buying on weakness is the prudent thing to do.
On the daily chart below, gold made a lower high recently; while the dollar made a higher high; and the euro made a lower low. As mentioned earlier, this is a bit of underperformance and represents a negative divergence of sorts.
It could be resolved to the upside, or it could be resolved to the downside. A resolution to the downside that holds support will offer a better risk to reward ratio to add to positions.
Each individual investor must decide for themselves, which is the best method of trading and investing for their unique situation. There is no holy grail for all.
Silver
Silver had a tough week, falling -5.44%. Last week silver gained 4%, but the prior week it lost 9%. This means that silver is down over 10% in the last three weeks since making its recent new high.
The last two weeks, silver has bumped up into overhead resistance and could not get through. This week's candle is a bearish engulfing candlestick - it completely engulfs (encompasses) the high and low of the previous week's candle; and the candle closed below last week's close by 5%. This could signal a short term trend reversal is in the making.
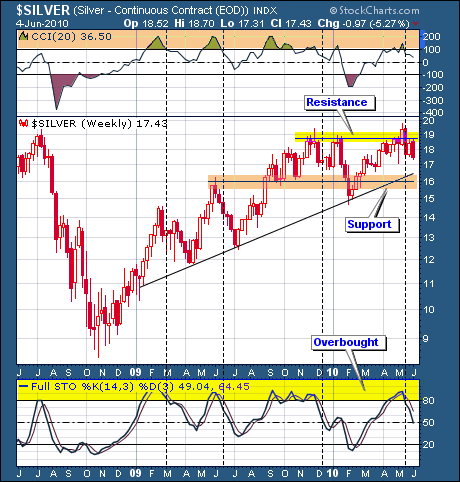
On the weekly chart above, the vertical dotted lines show similar previous set-ups that led to corrections in the past.
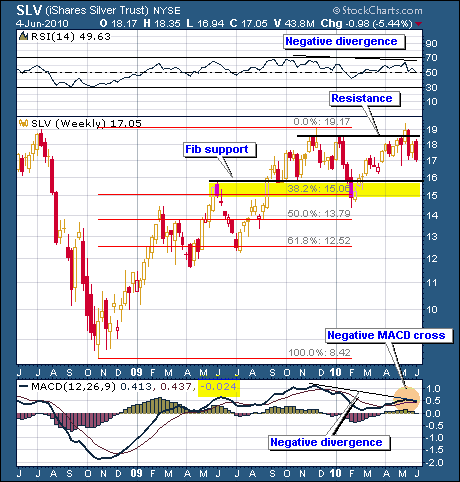
Next up is the weekly SLV chart, which shows negative divergences in both RSI & MACD, which is also under a negative crossover. Taken together the indicators suggest further downside action. Support is at the first Fib level.
The above excerpt is from this week’s 42 page market wrap report, available on the Honest Money Gold & Silver Report website. All major markets are covered: stocks, bonds, currencies, and commodities, with the emphasis on the precious metals. Gold and silver stocks are covered in detail.
Dozens of charts are available and our stock watch list provides numerous investment ideas each week, while our model portfolio offers a game plan to implement them. A FREE one-month trial subscription is available. Stop by and check it out.
Good luck. Good trading. Good health, and that’s a wrap.

Come visit our website: Honest Money Gold & Silver Report
New Audio-Book Now Available - Honest Money
Douglas V. Gnazzo
Honest Money Gold & Silver Report
About the author: Douglas V. Gnazzo writes for numerous websites and his work appears both here and abroad. Mr. Gnazzo is a listed scholar for the Foundation for the Advancement of Monetary Education (FAME).
Disclaimer: The contents of this article represent the opinions of Douglas V. Gnazzo. Nothing contained herein is intended as investment advice or recommendations for specific investment decisions, and you should not rely on it as such. Douglas V. Gnazzo is not a registered investment advisor. Information and analysis above are derived from sources and using methods believed to be reliable, but Douglas. V. Gnazzo cannot accept responsibility for any trading losses you may incur as a result of your reliance on this analysis and will not be held liable for the consequence of reliance upon any opinion or statement contained herein or any omission. Individuals should consult with their broker and personal financial advisors before engaging in any trading activities. Do your own due diligence regarding personal investment decisions. This article may contain information that is confidential and/or protected by law. The purpose of this article is intended to be used as an educational discussion of the issues involved. Douglas V. Gnazzo is not a lawyer or a legal scholar. Information and analysis derived from the quoted sources are believed to be reliable and are offered in good faith. Only a highly trained and certified and registered legal professional should be regarded as an authority on the issues involved; and all those seeking such an authoritative opinion should do their own due diligence and seek out the advice of a legal professional. Lastly Douglas V. Gnazzo believes that The United States of America is the greatest country on Earth, but that it can yet become greater. This article is written to help facilitate that greater becoming. God Bless America.
Douglas V. Gnazzo © 2010 All Rights Reserved
© 2005-2022 http://www.MarketOracle.co.uk - The Market Oracle is a FREE Daily Financial Markets Analysis & Forecasting online publication.


