


S&P500 Stuck Below Its 200-Day Average
Stock-Markets / Stock Markets 2010 Jun 08, 2010 - 08:32 AM GMTBy: Richard_Shaw

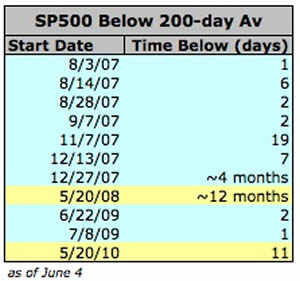
 The S&P 500 index (proxies SPY and IVV) has closed below its 200-day average now for 11 straight days. Outside of the "2008 pre-crash" that lasted about 4 months beginning 12/27/07, and the 2008 crash that lasted about 12 months beginning 5/20/08; the current period below the 200-day average is the second longest in the past several years. That's a bad sign.
There were six episodes in 2007 before the 4-month 2008 pre-crash. Those periods below the 200-day average ranged from 1 day to 19 days. There were two periods in 2009, of 1 and 2 days, as the index worked its way out of the cellar, and as the 200-day average was flattening before trending upward.
This period below the 200-day average is the first of 2010, and is showing signs of "commitment" to being there below that average.
Many investors consider a price below the 200-day average to be a bear condition. It's not yet at the 20% decline that others call a bear, but it certainly is not a good sign -- and the US market is the best market this year -- most others look a lot worse.
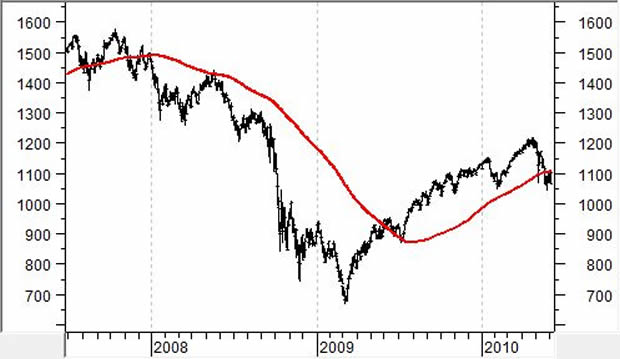
Here is a compressed chart that can give a flavor of the periods below the 200-day average (shown in red). Of course to count closings below any average, you need to use a greatly expanded chart which would not fit on your screen as an image.
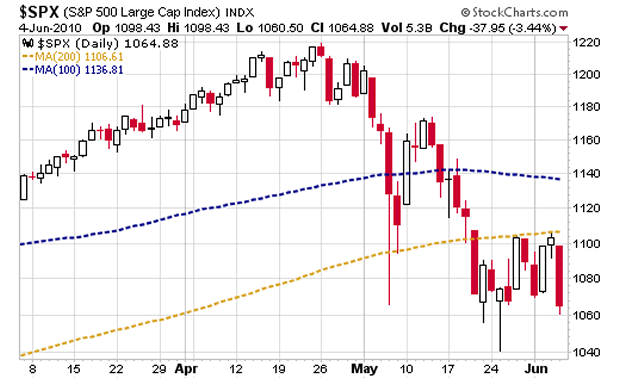
For a closer look at the current period below the 200-day average (shown in gold, with 100-day shown in blue), this candle chart speaks loudly. Today's big drop suggests that Monday will probably be below the 200-day even if there is a rally, because the current price is about 3.8% below the average. It would take a big rally to get back over the 200-day average. We don't see the makings of that anywhere in the news.
It may only be VooDoo chicken bones on the ground, but in the past 11 market days, it looks like the index has tried and failed to pierce the 200-day average, which appears now to be a resistance line.
In any event, we've been out of the US equity market since the S&P 500 declined to 1180 to 1140 (7% to 10% above the current prices) depending on the client and their particular risk tolerances (basically exiting back in early May).
For added perspective, we personally exited Europe (VGK) at a price about 19.7% above the current price in late October 2009. We exited China (FXI) in early December 2009 at a price about 8% above the current price, and exited Brazil (EWZ) in late December 2009 at a price about 13.8% above the current price. However, we were not as effective with emerging markets in the aggregate (EEM), because we did not exit that security until mid-May at a price less that is about 3.7% higher than the current market
At this point, we are happily ensconced in cash and bonds, and won't be getting back into equities until the upward trend has resumed in a believable way security-by-security. We don't plan on buying anything that is below its 200-day average, plus some other requirements.
Holdings Disclosure: As of June 4, 2010, we do not own any securities mentioned in this article in any managed accounts.
By Richard Shaw http://www.qvmgroup.com
Richard Shaw leads the QVM team as President of QVM Group. Richard has extensive investment industry experience including serving on the board of directors of two large investment management companies, including Aberdeen Asset Management (listed London Stock Exchange) and as a charter investor and director of Lending Tree ( download short professional profile ). He provides portfolio design and management services to individual and corporate clients. He also edits the QVM investment blog. His writings are generally republished by SeekingAlpha and Reuters and are linked to sites such as Kiplinger and Yahoo Finance and other sites. He is a 1970 graduate of Dartmouth College.
Copyright 2006-2010 by QVM Group LLC All rights reserved.
Disclaimer: The above is a matter of opinion and is not intended as investment advice. Information and analysis above are derived from sources and utilizing methods believed reliable, but we cannot accept responsibility for any trading losses you may incur as a result of this analysis. Do your own due diligence.
Richard Shaw Archive |
© 2005-2022 http://www.MarketOracle.co.uk - The Market Oracle is a FREE Daily Financial Markets Analysis & Forecasting online publication.