Implications of the Gold Silver Price Divergence...
Commodities / Gold and Silver 2010 Jun 06, 2010 - 02:15 PM GMTBy: Clive_Maund
 In this article we are going to consider the implications of gold’s new highs of late last year and a month or so ago not being confirmed by new highs in either silver or the Precious Metal stock indices, and consider other factors having an important bearing on the outlook. Normally such a non-confirmation results in a reversal, if it persists, which is why it is a focus of concern at this time.
By sequencing the 3-year charts of gold, silver and the HUI index one beneath the other below, we can readily compare and contrast them. From this comparison the marked and persistent non-confirmation of gold’s breakout to new highs and continued progress is obvious, which can otherwise be described as silver and PM stocks having been weak compared to gold. What does this mean? - it means that something is not right - to put it crudely it smells. Either silver and Precious Metals break out to new highs soon or gold is going to stumble and fall.
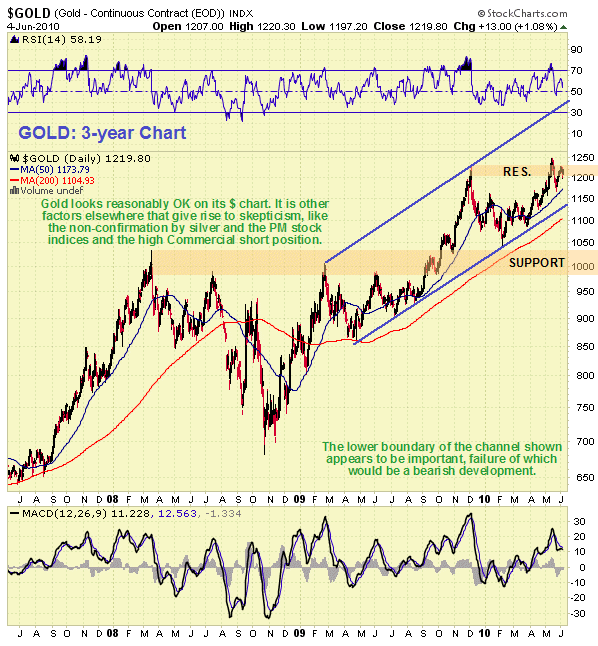
By itself, gold’s chart looks OK with an unbroken parallel uptrend in force and the possibility of acceleration. However, the latest upleg resulting in a breakout to new highs about a month ago looks rather weak and there has been a lack of follow through. The uptrend shown is validated by 4 points of contact with its lower boundary, a break below which would therefore be bearish. Moving averages remain in bullish alignment.
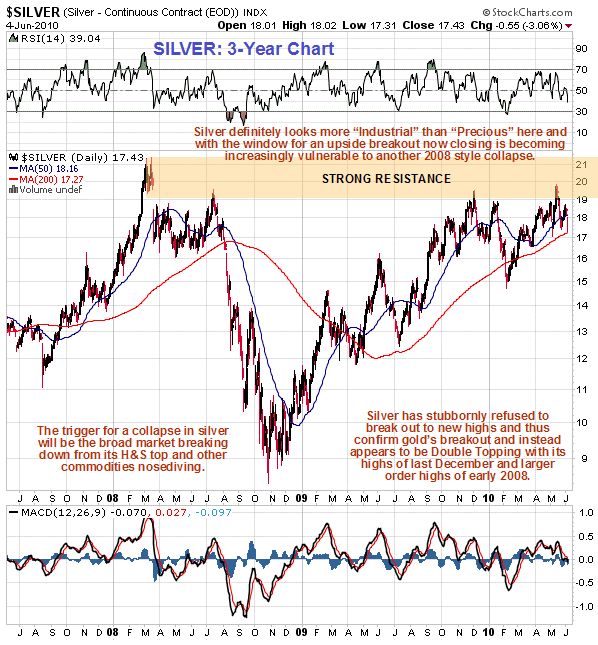
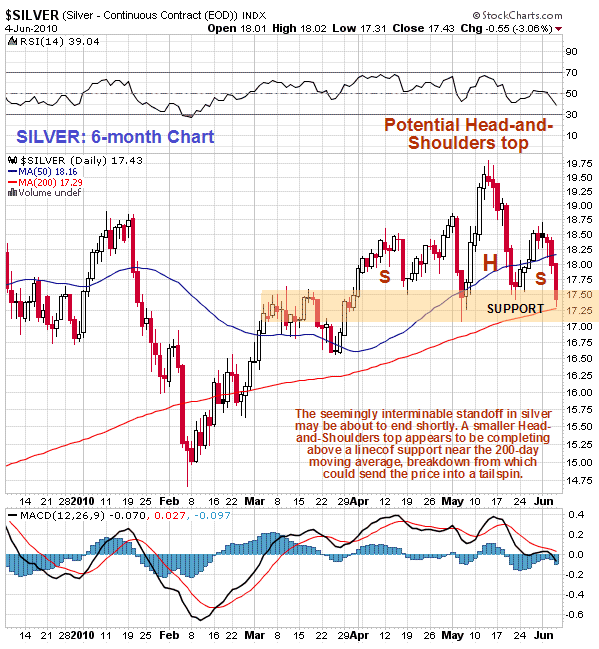
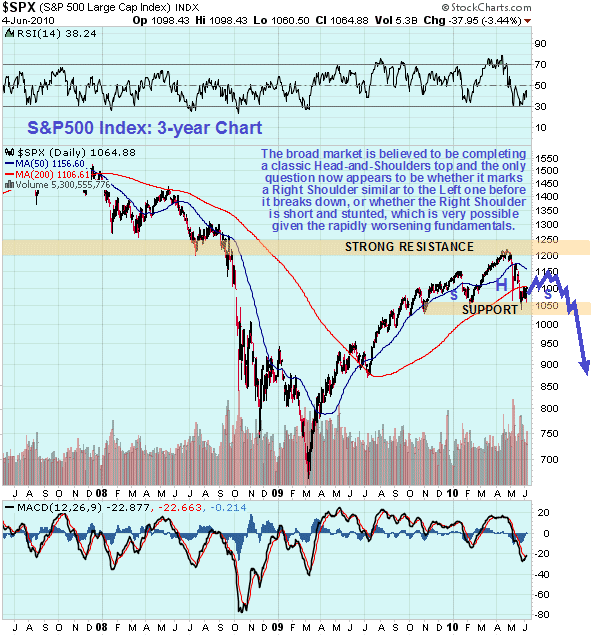
Silver is a very different story - it has been unable to break above its highs of last December with which it is suspected to be forming a Double Top, and also unable to break above its highs of 2008, with which it is suspected to be in danger of forming a larger order Double Top. Clearly silver is being treated more as an industrial metal than a Precious Metal, which does not bode well in the event that the commodity complex and stockmarkets cave in 2008 style, which they are showing signs that they will do before much longer. Base metal prices generally have been weakening and the broad market appears to be completing a Head-and-Shoulders Top, and while there may be a rally of sorts over the next month or two that unwinds the current oversold condition with the formation of a symmetrical Right Shoulder, this Right Shoulder may be stunted and of shorter duration due to the impact of increasingly bearish fundamentals. This possible rally is the window of opportunity for silver and PM stocks to break out upside, but right now the chances of this happening don’t look good, especially as on the 6-month chart for silver, shown below, it looks like it may be completing a smaller Head-and-Shoulders top above a line of support near its 200-day moving average.
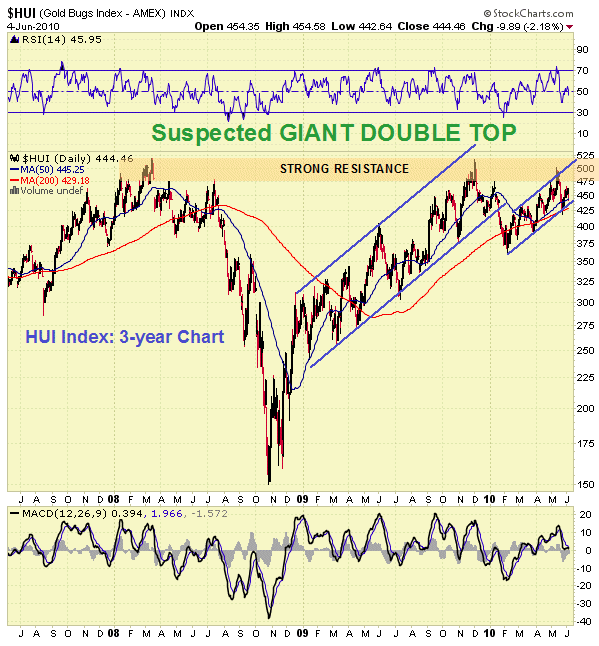
The 3-year chart for the HUI index looks remarkably similar to that for silver. It too has a window of opportunity to break out upside whilst the broad market Right Shoulder completes, a window that could last for a month or two, but is thought likely to close up more quickly. From this chart it is clear that the strong resistance in the 500 area is a major hurdle, and should it fail to break above this, it will be vulnerable to a really savage decline in the event that the broad market breaks down from its Head-and-Shoulders top as expected. As with silver the current tight bunching of the index and its moving averages suggests that resolution of the current standoff is likely sooner rather than later. A break of the uptrend in force from early this year will be viewed as a bearish development.
There are various other indications on the charts that the risk for the sector is high going forward and we will now briefly review some of them.
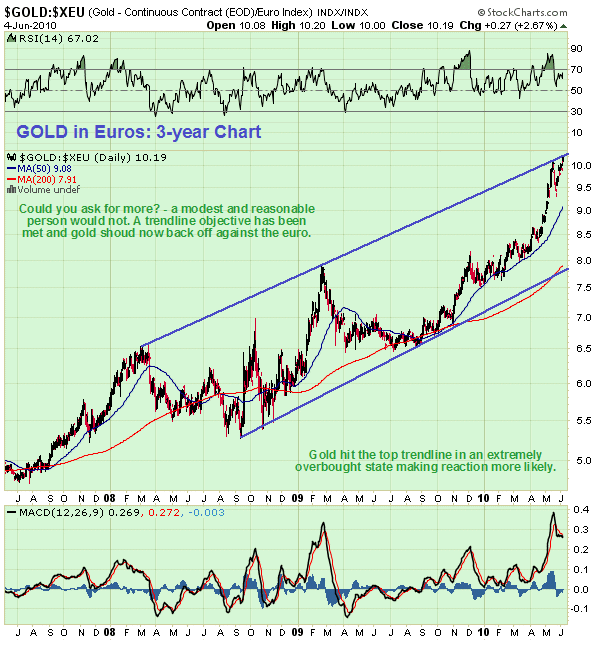
One point worth noting, particularly for European investors, is that gold has risen strongly to hit an intermediate target against the euro, and given that it arrived at this target in a critically overbought condition, a prolonged period of reaction is now probable. We can see this clearly on the 3-year chart for gold in euros shown above.
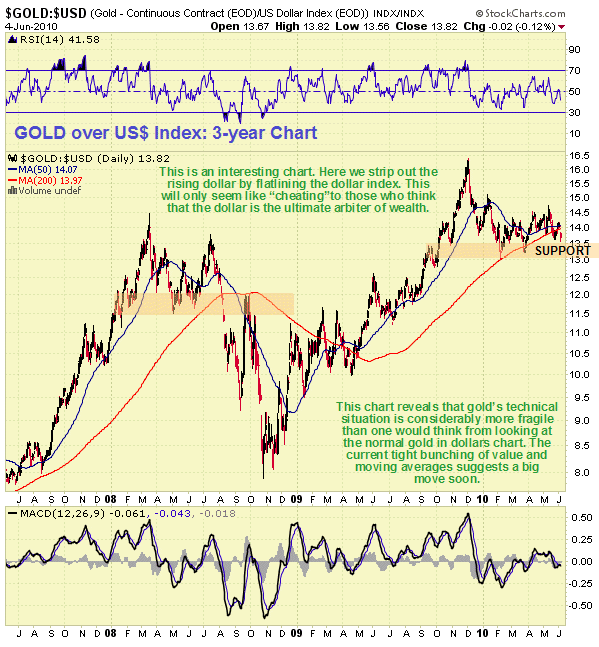
Because the dollar price of gold has actually been rising at a time when the dollar itself has been strong, largely due to the euros’ misfortunes, there is a temptation to view this as a “double whammy”, a double gain, which of course it is in the normal sense. However, the dollar is just another doomed fiat currency even if it is the “big kid on the block“, and is in fact ultimately more doomed than most, so it is interesting to strip out the dollar’s rise by plotting a chart for gold over the dollar index, which effectively flatlines the dollar index. This chart reveals that gold’s technical situation is considerably more fragile than its normal chart in dollars would suggest, with the current tight bunching of the value and moving averages above a relative support line opening up the risk of a heavy decline.
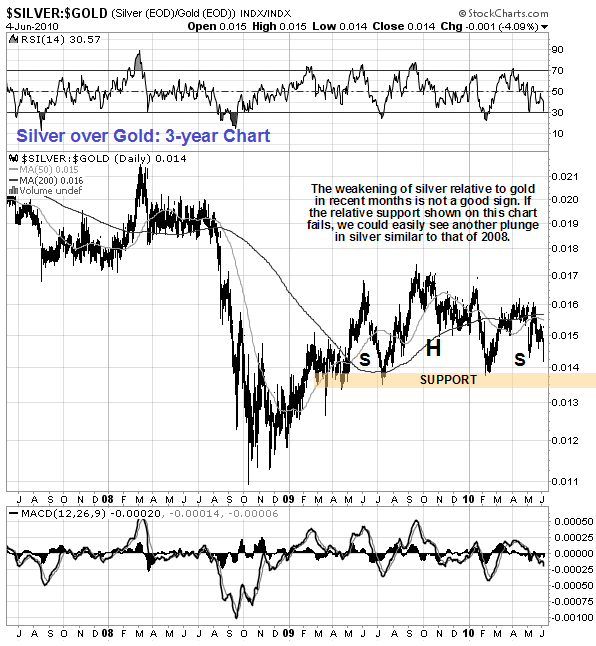
Returning to our central theme of gold’s new highs being unconfirmed by silver, the 3-year chart for silver over gold shows how silver has continued to weaken relative to gold, with a relative Head-and-Shoulders top looking like it is completing above a relative support line, failure of which would probably lead to a substantial drop in the entire PM sector and a plunge in silver prices. Given the industrial component of the silver price this underperformance implies a weakening outlook for the economy, especially as it has occurred against the background of retreating base metal prices and a completing Head-and-Shoulders top in copper.
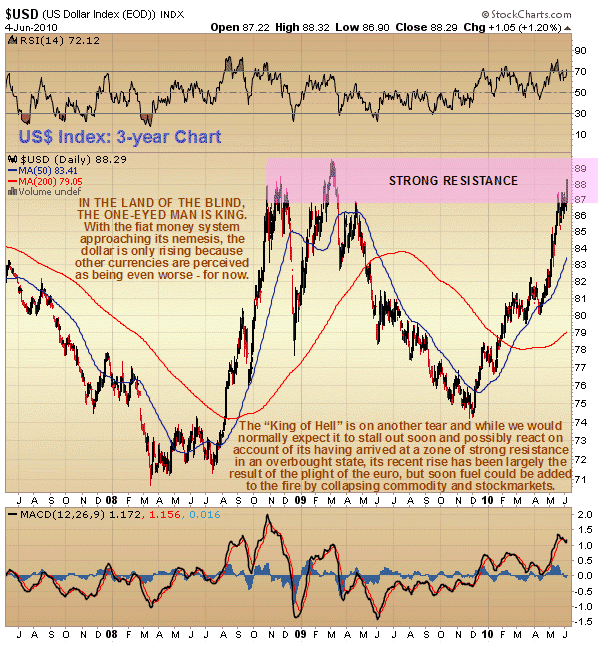
The 3-year chart for the dollar index shows the strong uptrend of late, and while it looks rather similar to the strong uptrend of 2008, we should keep in mind that this time round the advance to date has been largely thanks to the collapse of the euro, and not to a collapse in the commodity and stockmarkets. Normally, after a rise of this magnitude, we would expect the dollar’s advance to stop about here and a period of consolidation/reaction set in, as it is now substantially overbought and at a zone of major resistance, and while this could happen as the broad market completes the Right Shoulder of its Head-and-Shoulders top in coming weeks, it is likely to gain additional traction once the broad market breaks down and there is another “flight to safety” into bonds and the dollar, very similar to that which occurred in 2008, although with the underpinnings of the US economy and Treasury market coming apart, many investors who will think that they have found safe haven will eventually come to realize that they have jumped from the frying pan into the fire.
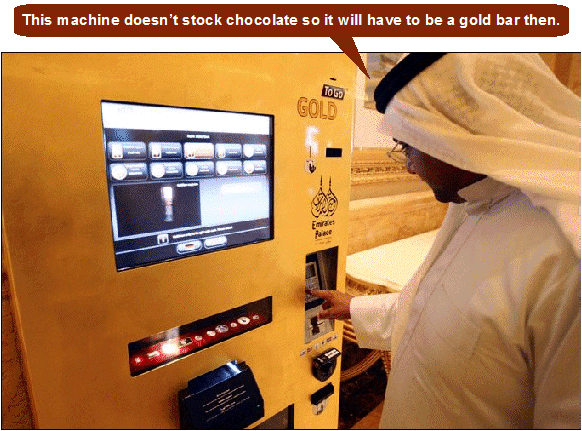
If all of the above arguments don’t quite cut it with you, you might like to consider the following. The Commercials’ short positions in gold are almost at their most bearish levels ever, historically - greater than just before the plunge in 2008. In addition, while it is of course highly amusing to find gold vending machines at airports, this is just the kind of manifestation that we do want to see if we want gold to go up.
On www.clivemaund.com while we will not be surprised to see some sort of recovery rally in the broad market over the next month or so, we are generally in defensive mode, as the downside risk going forward is considered to be much higher than the potential upside. This means cash, protection of any open long positions with Puts, and the use of conservative bear plays primarily to preserve capital but also as a means to profit from the expected heavy declines, for given that markets tend to drop twice as fast as they go up, because panic is a more powerful emotion than greed, as made plain by the events of 2008, there is no reason why we should sit on our hands and pass up the opportunities that will be presented by the general misfortune.
If we do see another commodity and stockmarket rout that drags the Precious Metals sector down with it, does it mean that the PM sector bull market is over? - no. As set out in last week’s article The Looming Financial Holocaust, gold could fall to the $900 or even to the $800 area without violating its long-term uptrend, and the response of governments to a second downwave can be expected to be similar in nature to their response after the 2008 meltdown, which is more money creation and bailouts and monetization, but this time not just involving companies that are too big to fail, but countries that are too big too fail. Since the buck has to stop somewhere, and the US and UK and many other countries are technically insolvent, that means inflation - hyperinflation, which is of course very bullish for the Precious Metals.
By Clive Maund
CliveMaund.com
For billing & subscription questions: subscriptions@clivemaund.com
© 2010 Clive Maund - The above represents the opinion and analysis of Mr. Maund, based on data available to him, at the time of writing. Mr. Maunds opinions are his own, and are not a recommendation or an offer to buy or sell securities. No responsibility can be accepted for losses that may result as a consequence of trading on the basis of this analysis.
Mr. Maund is an independent analyst who receives no compensation of any kind from any groups, individuals or corporations mentioned in his reports. As trading and investing in any financial markets may involve serious risk of loss, Mr. Maund recommends that you consult with a qualified investment advisor, one licensed by appropriate regulatory agencies in your legal jurisdiction and do your own due diligence and research when making any kind of a transaction with financial ramifications.
Clive Maund Archive |
© 2005-2022 http://www.MarketOracle.co.uk - The Market Oracle is a FREE Daily Financial Markets Analysis & Forecasting online publication.


