Safe Havens are Shining but are Stocks About to Rocket Higher?
Stock-Markets / Financial Markets 2010 Jun 06, 2010 - 12:42 PM GMTBy: Chris_Vermeulen

 It was another extremely volatile week sharp rallies followed by sharp sell offs. Fear is in no doubt controlling the market. The bulls and bears continue to battle it out. The charts below cover some important trends and market internals I pay attention to on a daily basis.
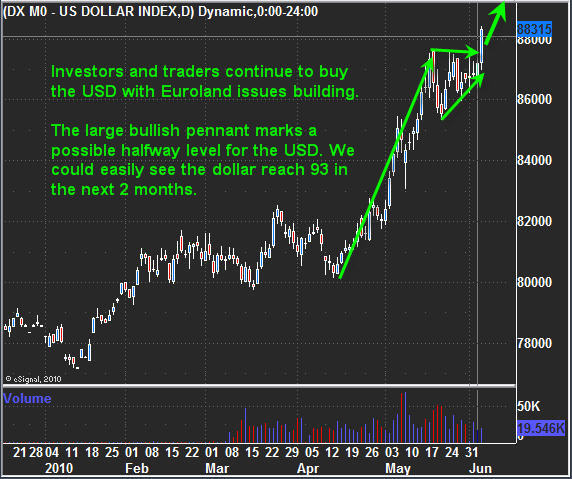
US Dollar Index – Daily Chart
The past two months the dollar as been in rally mode. The last 14 days we have seen a large bullish pennant form and this pattern typically marks the half way point for the current tend. The measured move for the USD is pointing to 93 over the next few months.
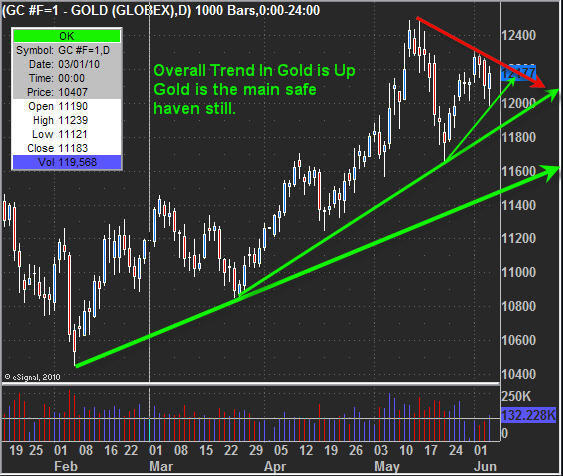
Gold Futures Prices – Daily Chart
Gold as we all know is seen as the major safe haven and the price per ounce has been steadily climbing. Friday we saw the major indexes sell down very hard but both the dollar and gold posted some solid gains. Gold does looks as though it needs some time to digest the recent move higher and this could take a week or two before anything exciting happens but I am on the lookout for low risk setups.
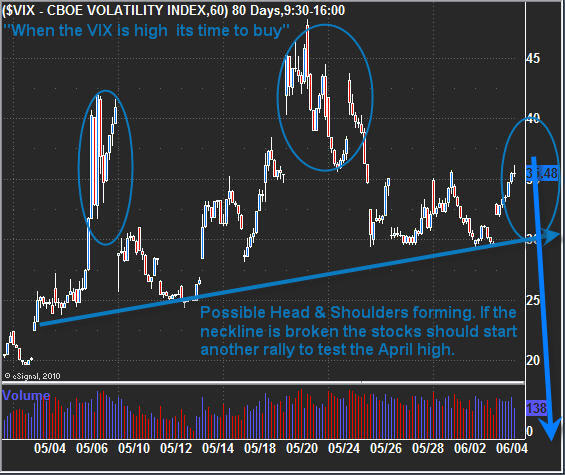
VIX – Volatility Index – 60 Minute Chart
This index measures the fear in the market. When fear is high and everyone is selling their positions we see the VIX jump in price. Over the past month we can see a possible Head & Shoulders pattern forming. If this pattern unfolds like it should then we will see the price of equities bottom in the coming week with the VIX dropping below the blue neckline. The old saying is “When the VIX is High is time to Buy, when the VIX is low its time to Go”.
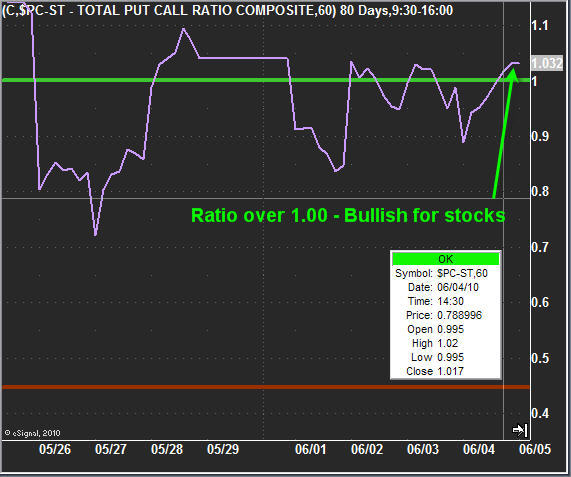
Put Call Ration – 60 Minute Chart
In short, when the put/call ration is over 1.00 then there are more traders/investors buying Put Options than Call Options. Put options are when people are buying leverage to take advantage of lower prices. My thought/opinion about this is when more people are trading with leverage anticipating lower prices, I figure they have sold all their long positions and are now using leverage to profit from lower prices. Well if the majority of individuals have sold everything then in reality there should not be much left to be sold… So I feel this correction which started in April is almost finished.
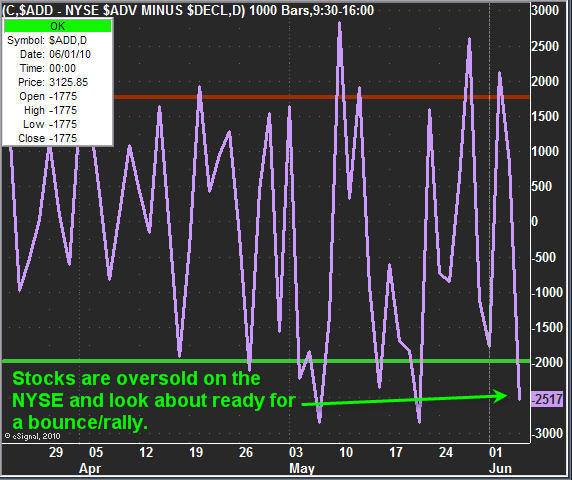
NYSE Advance/Decline Line – 60 Minute Chart
This is one of my favorite charts to look at. While there are several indicators, market internals and technical analysis needed to clearly determine if the market is currently overbought or oversold, this chart is one that can help give you a good idea if you should be looking to buy, short or just stay in cash for the time being.
SP500 Futures Prices- 2 Hour Chart
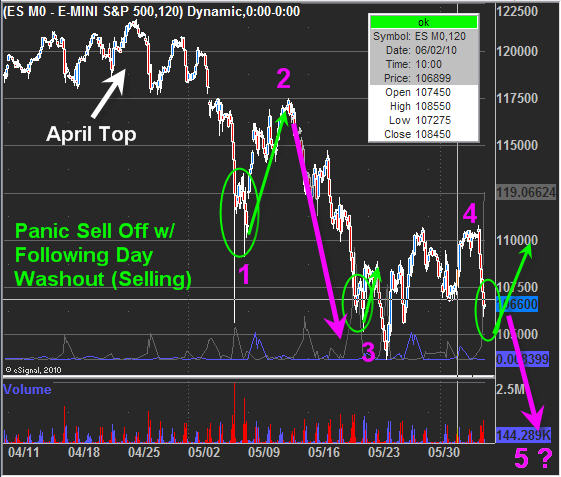
The SP500 has been up and down like a yo-yo with some very dramatic moves. Up 2+% day down 2+% the next… very sharp and powerful moves can be both every profitable or costly if not traded correctly. Last week we caught a nice 2% gain in less than 24 hours which was an exciting trade. It looked at though the market was about to breakout to the upside and possibly reach the 1150 level but early Friday morning there were rumors about some Euro bank having serious problems and that was just enough to cause a domino effect sending the market lower throughout the entire session closing on a very strong negative note for the day/week.
That being said the market internals are indicating that equities are oversold at these current prices and a bounce is due any time. With the panic selling on the NYSE Friday reaching 119 sell orders for every 1 buy order I think we will see some follow through next week with lower prices, then a rebound once investors finish selling everything they own at which point we will be looking to get involved again.
Weekly Trading Conclusion:
In short, money continues to flow into the safe havens (Gold & US Dollar). The major indices are showing extreme panic selling and look ready to in the next few days. There is a possibility that the market could break down and start another major leg lower which is a big concern to me. I will be glued to the market internals and support levels for the major commodities and equity sectors in hopes to catch the bottom or to avoid another melt down.
If you would like to receive my Real-Time Trading Signals & Trading Education check out my website at www.FuturesTradingSignals.com
By Chris Vermeulen
Chris@TheGoldAndOilGuy.com
Please visit my website for more information. http://www.TheGoldAndOilGuy.com
Chris Vermeulen is Founder of the popular trading site TheGoldAndOilGuy.com. There he shares his highly successful, low-risk trading method. For 6 years Chris has been a leader in teaching others to skillfully trade in gold, oil, and silver in both bull and bear markets. Subscribers to his service depend on Chris' uniquely consistent investment opportunities that carry exceptionally low risk and high return.
This article is intended solely for information purposes. The opinions are those of the author only. Please conduct further research and consult your financial advisor before making any investment/trading decision. No responsibility can be accepted for losses that may result as a consequence of trading on the basis of this analysis.
Chris Vermeulen Archive |
© 2005-2022 http://www.MarketOracle.co.uk - The Market Oracle is a FREE Daily Financial Markets Analysis & Forecasting online publication.


