Silver and Contracting U.S. Money Supply Flash Gold Trend Warning
Commodities / Gold and Silver 2010 Jun 06, 2010 - 06:53 AM GMTBy: Ned_W_Schmidt
 How many nations must experience a traumatic withdrawal from addiction to debt? Repeatedly, now
again with Portugal, we have confirmation that one cannot borrow one’s way to prosperity.
Keynesian economic dogma must be declared a complete failure. What Texas really needs to purge
from its text books is all reference to Keynesian economic dogma, perhaps saving the financial souls
of future generations.
Investors seem to be having great difficulty in finding direction as the debt delusion ends. U.S. equity market, now firmly back in a bear market, may provide some clues. We can now acknowledge that the positive movements in so many investment markets this past year were simply the consequence of the massive liquidity injection by Federal Reserve, and other central banks. $Gold too has clearly ridden that liquidity wave. Regrettably, the liquidity wave has peaked, and markets are being choked by the lack of liquidity.
Almost a month has passed since $Gold made a high. Such a time period is not sufficiently long to cause great concern for precious metal investors It is, however, of sufficient length to begin to change the thinking of traders. Of considerable importance may be $Silver’s technical break down on Friday. $Silver is broken, and that may give us a clue to $Gold.

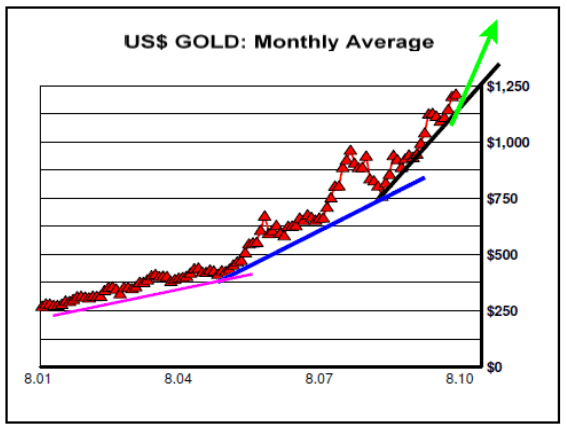
Last we talked was a discussion of the possible parabolic curve evident in a longer term chart of $Gold. In the above chart we have shortened the time frame. Monthly average price of $Gold is used in chart to help prevent trading noise from interfering with the clarity of the picture. A parabolic market move is not an interpretation. It is the manifestation of a mathematical property.
In that chart are drawn several lines to portray the slope of the curve in different periods. Moving to the right, each of those lines has a greater slope than the previous. The black line is steeper than the blue line which is steeper than the line before it. A parabolic move is simply a market move that gets stronger the more price rises. It is unnatural. It defies financial gravity. It is doomed to failure.
While a raving long-term bull on Gold, realization that markets do correct should always temper our enthusiasm. Markets sometime go no where for a period of time. And most often, markets do not do what we want them to do. Markets are not listening to your thoughts. Investors deeming that Gold should go up will not cause it to go up. Only money flowing into the Gold market, or any other market, can cause the price to rise. In the past year a lot of money has flowed into Gold. That money flow is a finite stream, subject to both interruption and an end.
As we wrote last time, we know not wether the end of this particular parabolic move is at hand. We will not know that till well into the correction from it. In the disappointment stage we will come to know if our investment hubris got somewhat out of hand. Risk for $Gold in the disappointment phase, when it comes, could be to US$750-970. Silver, having technically broken down, has downside risk this Summer to US$14-16. If you live in some other currency, apply your forecast for your currency to those values to give them meaning to you.

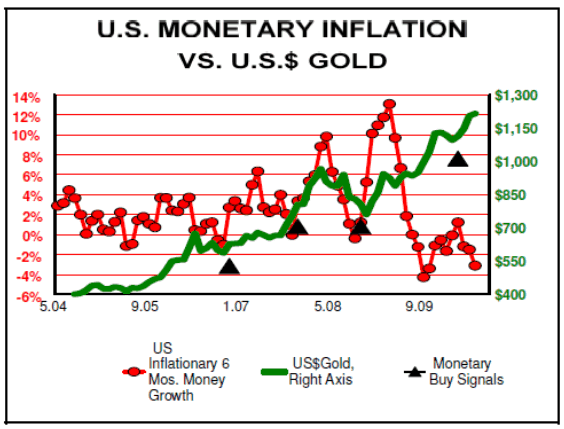
Our second chart, above, is part of the reason for the present concern. That line of red circles is the growth rate of the inflationary component of U.S. money supply, using M-2, NSA. When that measure is negative and turns positive, buy signals are triggered. Those are marked by the black triangles.
However, as can be observed in the chart, that measure has again turned negative. U.S. money supply is simply not growing. It certainly is not growing in an inflationary manner. It may next year, but it is not at the present time. That means the dollar has been becoming rarer on a relative basis. As a natural consequence, the value of the dollar has been rising. At some point in time that reality may creep into the price of $Gold.
Given the above concerns, investors may want to consider widening their ownership of precious metals. Rhodium(Rh), the rarest of metals, may be a viable addition to the portfolio of precious metals. At the present time, Rhodium(Rh) is deeply over sold relative to $Gold. Fears over the EU’s debt problems have been putting downward pressure on the prices of commodities of all types. This response to what is a transitory event should be used to advantage by investors. To see more on Rhodium(Rh): http://valueviewgoldreport.com/files/..
By Ned W Schmidt CFA, CEBS
Copyright © 2010 Ned W. Schmidt - All Rights Reserved
GOLD THOUGHTS come from Ned W. Schmidt,CFA,CEBS, publisher of The Value View Gold Report , monthly, and Trading Thoughts , weekly. To receive copies of recent reports, go to www.valueviewgoldreport.com
Ned W Schmidt Archive |
© 2005-2022 http://www.MarketOracle.co.uk - The Market Oracle is a FREE Daily Financial Markets Analysis & Forecasting online publication.


