


Gold More Downside Looks Possible
Commodities / Gold and Silver 2010 Jun 06, 2010 - 05:52 AM GMTBy: Merv_Burak

 We had a little bounce on Friday but is this a reversal? I don’t think so, at least not a major reversal. More downside still looks possible ahead.
GOLD : LONG TERM
From the long term perspective we are still far from any serious reversal of trend. The P&F chart suggests a move to $1110 is needed for a reversal while the normal indicators seem to suggest something similar. Gold remains above its positive sloping long term moving average line while the momentum indicator remains well inside its positive zone. The momentum indicator is presently sitting right on top of its trigger line while the trigger slope is slightly to the down side. The volume indicator continues to track laterally at almost its all time high level and is above its positive sloping trigger line. I know many look at the volume to give them a good feel for the market, especially when the volume continues to be positive. However, I have found that the volume activity too often is a LAGGING indicator at market tops and after a significant upside move one should take this indicator with a grain of salt. In any way, the long term rating remains BULLISH.
INTERMEDIATE TERM
A few weeks back gold just touched my intermediate term moving average line and bounced. Although most technicians use a simple 50 day moving average line I prefer a 65 day weighted line. The two are not that much different but the weighted line usually gives me a few days extra warning of any crossing by the price. As far as the exponential moving average is concerned, some use it as it is a weighted type of average but easy to construct. It’s one failing from my standpoint is that by its construction the slope changes at the same time as the price crosses the line. I like to see the line slope slightly following a crossing of the line by a few days as a small effort to catch possible whip-saw events.
The gold action has been above the positive sloping intermediate term moving average line all week, all 4 days. The momentum indicator also remained in its positive zone all week. It closed on Friday very slightly above its positive sloping trigger line. As for the volume indicator, although it remains above its positive trigger line the trigger is very close to the indicator and closing in. The trigger could cross above the line in a few days depending upon the trading activity. For now the intermediate term rating remains BULLISH. This rating continues to be confirmed by the short term moving average line remaining well above the intermediate term line.
SHORT TERM
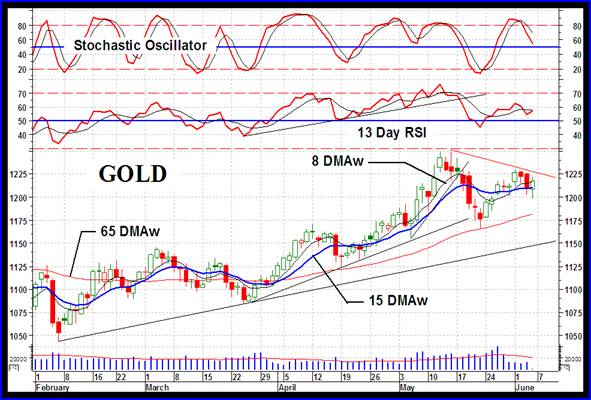
The short term top in mid-May was well forecast with trend lines, negative divergence and moving average (or trigger line) breaks. Now what? Well, this past week he had some firming up of the price but not yet enough to give the confidence that the short term reversal has taken its course. Should gold continue higher and close above that down trend line and above this past week’s action I would then be inclined to say that the short term reversal has had its course.
The P&F chart works quite well on the long term and I have been asked about a short term P&F chart. Well, the volatility of the gold activity just does not lend itself to a good P&F chart that I have been able to construct. There are just too many bull and bear signals that are better placed with the normal indicators and trend lines. Trend lines are nothing other than support or resistance lines except that they are sloping rather than horizontal.
Following that bear signal given by my accelerating bearish FAN trend lines and the blow-off occurrence at about the $1210 level, confirmed by subsequent action, we remain in a bearish trend although the rally of the past couple of weeks is interesting. Although we have that high during the week to overcome and the down trend line to break, the normal indicators have already reversed direction. Gold is trading above its short term moving average line and the line slope has turned upwards. The momentum indicator has moved into its positive zone although it is still very slightly below its negative sloping trigger line. The daily trading volume leaves a lot to be desired. Hopefully it will improve during the coming week. The indicators are giving us a BULLISH rating. The very short term moving average line confirms this rating as it trends higher above the short term line.
As for the immediate direction of least resistance, we have some conflicting indicators so I’ll go with the lateral direction. The Stochastic Oscillator has not yet turned back to the up side and the price is still below its previous three days of trading.
SILVER
Well, it looks like we are on our way to the $15 level. Last week I showed the daily chart of silver with a head and shoulder pattern. On Friday silver broke below its neckline providing that projection to the $15 level. There is still one encouraging technical note. The P&F chart often shown here has had a support at the $17.50 level for some time. It requires a move to $17.00 or lower to be broken on the down side so we might still have a little encouragement that the H&S neckline break was premature and this P&F support will continue to be held.
As for our normal indicators, on the long term silver has dropped below its moving average line but the line is still very, very slightly on the upward slope. The momentum indicator is heading lower and is below its negative trigger line but has not yet entered its negative zone. The volume indicator is showing weakness and is below its negative trigger line. For now the long term rating is moving towards the bear but has not quite made it yet. The rating today is – NEUTRAL.
On the intermediate term things are more sharply focused. Silver is below its negative sloping moving average line. The momentum indicator has entered its negative zone and is below its negative trigger line. The volume indicator remains below its negative trigger line. The only possible rating for the intermediate term is a BEARISH rating. On Friday the short term moving average line crossed below the intermediate term line for confirmation of this rating.
On the short term the indicators are even more emphatic on the negative side. Silver remains below its negative moving average line. The momentum indicator is in its negative zone below its negative trigger line. The daily volume activity is very low and remains below its average volume for the past 15 days. All in all the short term rating is BEARISH. The very short term moving average line has moved below the short term line for confirmation of the rating.
PRECIOUS METAL STOCKS
It was basically a negative week for the precious metal (gold & silver) stocks. Most of the Merv’s Indices were lower anywhere from 1.2% to 4.0% with the Merv’s Penny Arcade Index taking the biggest hit at the 4.0% mark. The universe of 160 (not including the pennies) had seen a general decline of 114 stocks (71%) and only 40 advances (25%). The pennies were even worse with only 13% advancing and 77% declining. All in all not a good week.
I mentioned in the past the negative divergence of the momentum indicators versus their respective Indices. This gives one caution that a decline may be ahead and that just may be what we are experiencing at the moment. I expect the pennies to become bearish ahead of the general universe and this too seems to be in the process of happening. Since the start of the Penny Arcade bull move, at the end of 2008, we have had the Index moving higher consistently above a well defined up trend line. Now this line has been decisively breached to the down side for the first time in a year and a half, a bad sign. The intermediate term RSI is at its lowest point since the start of the penny bull and just about to go negative. All signs point to a possible collapse in the pennies although not yet. There are still a few going gung-ho on the up side but in general the pennies are starting to look weak. This does not portend well for the universe in general as they should follow the penny on the decline. What the time lag would be is an unknown for now but the weakness is being noted in the universe even now.
Until the Merv’s Indices, and especially the Composite Index, turn back to the up side and move into new high territory we must assume the path ahead is dangerous on the buy side.
Merv’s Precious Metals Indices Table
Well, I think I’ll call it another day.
By Merv Burak, CMT
Hudson Aero/Systems Inc.
Technical Information Group
for Merv's Precious Metals Central
For DAILY Uranium stock commentary and WEEKLY Uranium market update check out my new Technically Uranium with Merv blog at http://techuranium.blogspot.com .
During the day Merv practices his engineering profession as a Consulting Aerospace Engineer. Once the sun goes down and night descends upon the earth Merv dons his other hat as a Chartered Market Technician ( CMT ) and tries to decipher what's going on in the securities markets. As an underground surveyor in the gold mines of Canada 's Northwest Territories in his youth, Merv has a soft spot for the gold industry and has developed several Gold Indices reflecting different aspects of the industry. As a basically lazy individual Merv's driving focus is to KEEP IT SIMPLE .
To find out more about Merv's various Gold Indices and component stocks, please visit http://preciousmetalscentral.com . There you will find samples of the Indices and their component stocks plus other publications of interest to gold investors.
Before you invest, Always check your market timing with a Qualified Professional Market Technician
Merv Burak Archive |
© 2005-2022 http://www.MarketOracle.co.uk - The Market Oracle is a FREE Daily Financial Markets Analysis & Forecasting online publication.