


Deflationary Forces and Historical Stock Market Corrections
Stock-Markets / Stock Markets 2010 Jun 05, 2010 - 05:47 AM GMTBy: Chris_Ciovacco

 With a weak employment report on Friday, problems in Europe, and financial markets in a precarious technical condition, it is helpful to review similar historical stock market corrections. From a fundamental perspective, our present day concerns relate to deflationary forces in the global economy. Unlike the U.S., which can expand the supply of dollars relatively easily, printing euros is more difficult since each member of the European Union has its own tax and spending policies. Printing euros may help the people of Greece in some ways while diminishing the purchasing power of German savers.
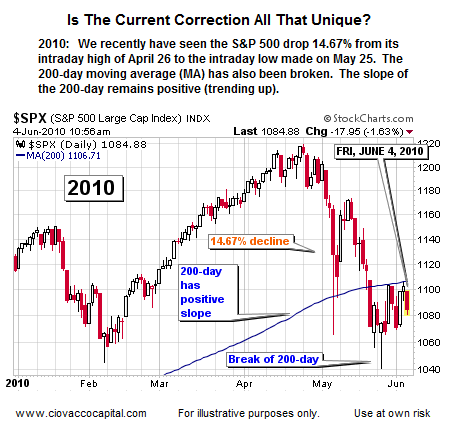
The situation and possible longer-term outcomes in Europe lean toward the deflationary camp, which is not good for asset prices. Continued high unemployment in the U.S. is also contributing to deflationary forces. Diminished demand for goods and services leads to lower pricing power for those selling goods and services. Asset markets want and need positive inflation in the current environment; recent events have increased the probability of longer-term deflation. The question of the day is will these deflationary forces derail the current bull market? A review of current market internals vs. history may give us some insight.
As shown in the table below, corrections of similar magnitude to what we have seen thus far in 2010 have been followed by rallies of some significance.
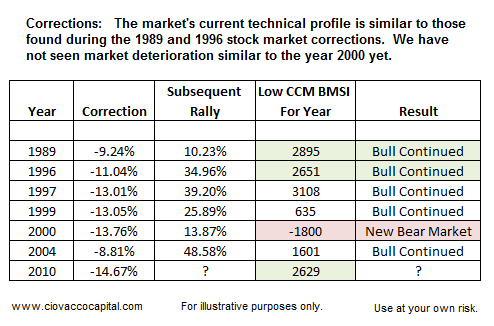
The CCM Bull Market Sustainability Index (BMSI) was developed to help better discern between a correction within a bull market and the possible onset of a new bear market. CCM BMSI scores are shown for the historical periods and current period in the table above. Current CCM BMSI scores continue to correspond to corrections within the context of an ongoing bull market, rather than those associated with the onset of a new bear market. Further market deterioration could occur, but for now the condition of the market's internals remain bullish for the longer-term from a probability perspective.
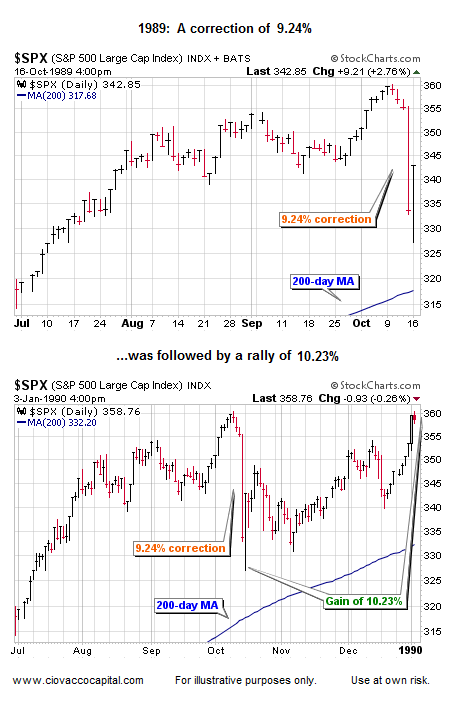
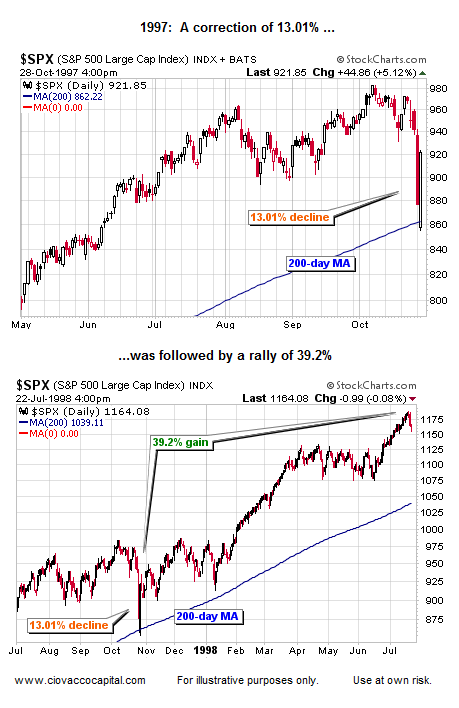
As all the historical examples shown here illustrate, there is a difficult and fine line between selling to protect principal and selling just before a substantial rally. Like 2010, in 1989 the slope of the 200-day MA was positive.
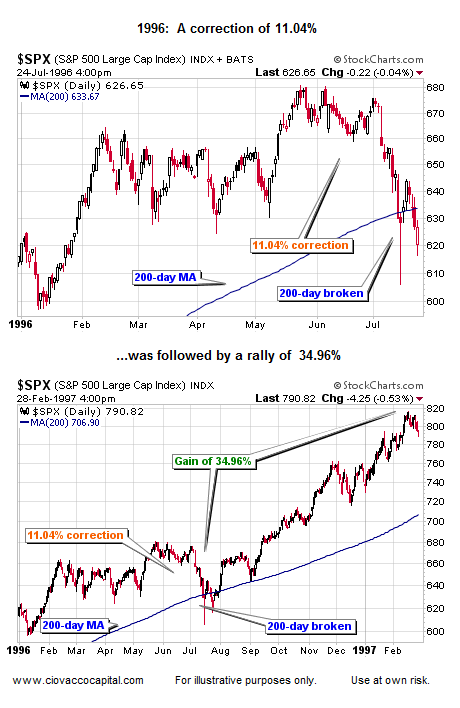
In 1996, the slope of the 200-day MA was positive during the correction.
In 1997, the slope of the 200-day MA was positive during the correction.
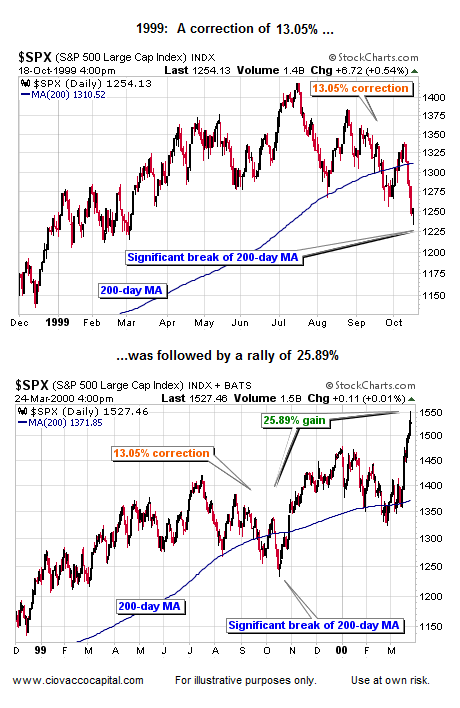
In 1999, the slope of the 200-day MA was positive during the correction.
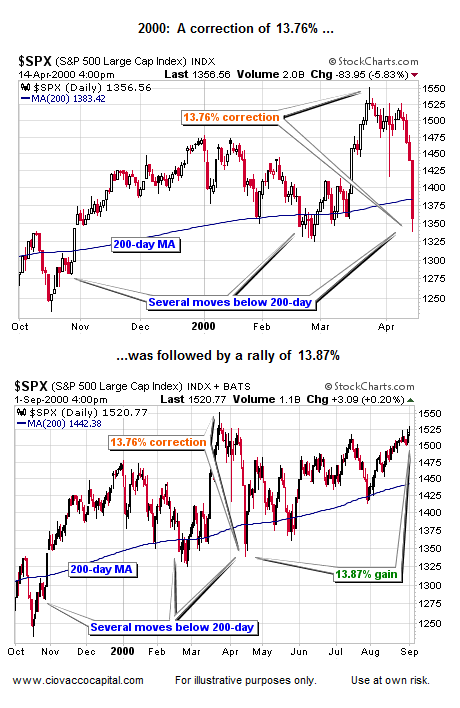
In 2000, the slope of the 200-day MA was positive during the initial correction off the bull market high, which allowed patient investors to reassess risk at higher levels.
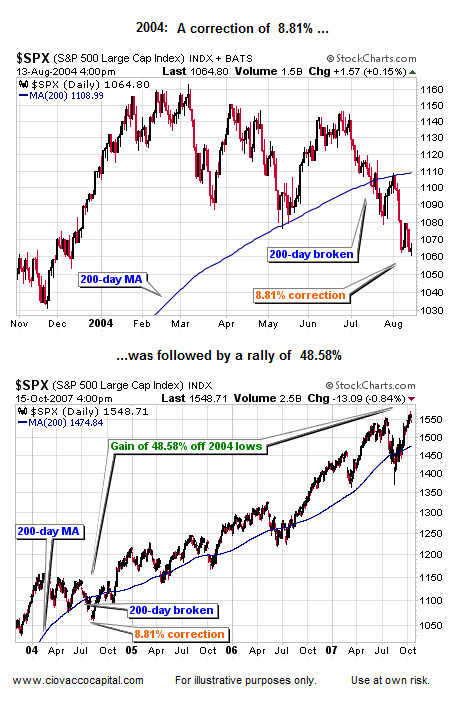
In 2004, the slope of the 200-day MA was positive during the correction.
The Slope Of The 200-Day Can Be Significant
Our models and research align well with some interesting facts about when the market crosses below its 200-day moving average (which occured recently in May 2010). Conventional wisdom is that a break of the 200-day MA is bearish, but that is not the case if the slope of the 200-day moving average is positive (line is rising – as it is now in 2010). Some good stats were presented in an article posted on istockanalyst.com:
Ned Davis Research tells us that since 1946, there have been 64 cases in which the S&P 500 has crossed below its 200-day moving average when the MA was rising. But instead of the market going to heck in a hand basket as most investors would probably expect, two weeks later, the S&P has been higher by an average of +1.0%. The key point here is that this is actually BETTER than the buy-and-hold results for all 10-day periods of +0.5%. After crossing below a rising 200-day moving average, the S&P has been higher by +1.7%, which again is better than the +1.0% average for all the one-month periods since 1946. Even three months later, the market performs BETTER after it has crossed below its rising moving average as the S&P has posted gains of +3.6% versus the buy-and-hold returns of +2.2%.
While our long-term market models still remain bullish, it is prudent to have a detailed exit strategy in place should the markets deteriorate further. High debt levels in Europe and high unemployment in the U.S. are deflationary forces that need to be respected and closely monitored.
Additional comments can be found in Short Takes.
By Chris Ciovacco
Ciovacco Capital Management
Copyright (C) 2009 Ciovacco Capital Management, LLC All Rights Reserved.
Chris Ciovacco is the Chief Investment Officer for Ciovacco Capital Management, LLC. More on the web at www.ciovaccocapital.com
Ciovacco Capital Management, LLC is an independent money management firm based in Atlanta, Georgia. As a registered investment advisor, CCM helps individual investors, large & small; achieve improved investment results via independent research and globally diversified investment portfolios. Since we are a fee-based firm, our only objective is to help you protect and grow your assets. Our long-term, theme-oriented, buy-and-hold approach allows for portfolio rebalancing from time to time to adjust to new opportunities or changing market conditions. When looking at money managers in Atlanta, take a hard look at CCM.
All material presented herein is believed to be reliable but we cannot attest to its accuracy. Investment recommendations may change and readers are urged to check with their investment counselors and tax advisors before making any investment decisions. Opinions expressed in these reports may change without prior notice. This memorandum is based on information available to the public. No representation is made that it is accurate or complete. This memorandum is not an offer to buy or sell or a solicitation of an offer to buy or sell the securities mentioned. The investments discussed or recommended in this report may be unsuitable for investors depending on their specific investment objectives and financial position. Past performance is not necessarily a guide to future performance. The price or value of the investments to which this report relates, either directly or indirectly, may fall or rise against the interest of investors. All prices and yields contained in this report are subject to change without notice. This information is based on hypothetical assumptions and is intended for illustrative purposes only. THERE ARE NO WARRANTIES, EXPRESSED OR IMPLIED, AS TO ACCURACY, COMPLETENESS, OR RESULTS OBTAINED FROM ANY INFORMATION CONTAINED IN THIS ARTICLE. PAST PERFORMANCE DOES NOT GUARANTEE FUTURE RESULTS.
Chris Ciovacco Archive |
© 2005-2022 http://www.MarketOracle.co.uk - The Market Oracle is a FREE Daily Financial Markets Analysis & Forecasting online publication.