


Stock Market Technical Update: What’s Next?
Stock-Markets / Stocks Bear Market Jun 01, 2010 - 06:27 PM GMTBy: Graham_Summers

 In light of the growing market volatility, I thought it best to provide a technical update on where the markets are and what’s likely to come.
Many bulls view stocks’ latest drop as a buying opportunity. They are overlooking several glaring technical issues that warn very strongly that this correction is different from previous corrections occurring in the post-March 2009 rally.
Indeed, during this latest correction we’ve seen several developments occur for the first time since the March 2009 rally began. They are:
- A major break below the 50-DMA.
- A break below the 200-DMA followed by a failed attempt to reclaim that level.
- A new lower significant low.
Regarding #1, the market rally begun in March 2009 staged several breaks below the 50-DMA. However, every time this happened the market bounced back soon after.
Not this time.
As you can see, the S&P 500 failed to break above the 50-DMA in early Mary 2010. After this, it quickly rolled over and broke to new lows. This has never happened before during the March 2009-April 2010 rally. And it sends a strong message that the upward momentum has been severely damaged if not broken.
Regarding #2 (a break below the 200-DMA followed by a failed attempt to reclaim this level), once the market rally started in March 2009, we never once broke below the 200-DMA. In fact, we never even came close to breaking below this level.
That is, until today:
The fact that we’ve not only seen a break below the 200-DMA but appear to have failed to reclaim it is a MAJOR warning flag that this latest correction is different from the others occurring in the post-March 2009 rally. Indeed, this break even more than the break below the 50-DMA indicates that the long-term upward momentum for stocks is flagging.
On a final note, the correction started April 2010 also marks the first time the market staged a lower significant low. Every previous correction staged since the market rally began in March 2009 has seen the market fall to a higher significant low.
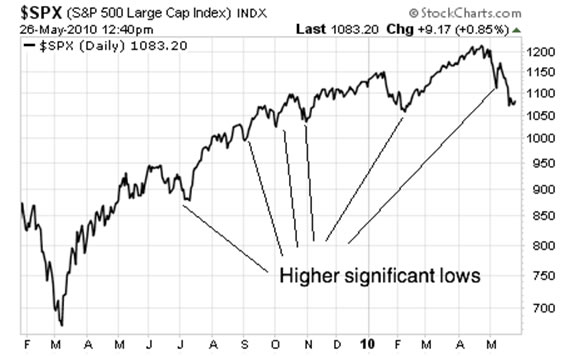
Not this time. On an intraday chart we took out the February 2010 low by a few handles. Again, this has never happened before. And it’s a major warning flag that all is not well in the markets.
However, I want to point out that this break only occurred on the intraday basis and was not confirmed by all indexes (only the S&P 500 and the Dow Jones Industrial Average). But it should still be seen as a serious warning (again this is the first time this has happened since the March 2009 rally began). And once the market hits a lower significant low on a closing basis, then we’re heading for real trouble.
Again, this latest correction is VERY different from the others occurring in the post-March 2009 rally. We’ve seen three new developments:
- A major break below the 50-DMA.
- A break below the 200-DMA followed by a failed attempt to reclaim that level.
- A new lower significant low.
Let all three of these be viewed as alerts that we are likely headed for a lot more trouble in the near-term. The fact the market barely broke above upwards resistance at 1,089 and then was rejected at the 200-DMA last week should be seen as a major warning that the upward momentum has been broken and the trend is now down.
Granted we’re going to see rallies as stocks collapse, (indeed we could see a move up to 1,150 before the next leg down occurs) but the market is very likely heading lower, a LOT lower in the now too distant future.
Indeed, my Crash indicator was triggered just a few weeks ago. This metric went off before the 1987 Crash, Tech Crash and 2008 Crash. The fact it’s going off now strongly suggests we’ll see a full-blown collapse in stocks within the next few months.
Our "Crash Indicator" Just Went Off!
A few weeks ago, I told subscribers of Private Wealth Advisory about a proprietary Indicator that has gone off before every Crash of the last 25 years. It triggered before the 1987 Crash, the Tech Crash, and the Crash in 2008.
It just registered another trigger two weeks ago. We’ve already opened seven trades to profit from it, realizing gains of 5%, 6%, 8%, even 11% in one week.
And we’re just getting started.
To find out about my "Indicator" and the Trades we've opened to profit from the coming market volatility...Click Here Now!
Graham Summers
PS. If you’re worried about the future of the stock market, I highly suggest you download my FREE Special Report detailing SEVERAL investments that could shelter your portfolio from any future collapse. Pick up your FREE copy of The Financial Crisis “Round Two” Survival Kit, today at: http://www.gainspainscapital.com/MARKETING/roundtwo.html
Graham Summers: Graham is Senior Market Strategist at OmniSans Research. He is co-editor of Gain, Pains, and Capital, OmniSans Research’s FREE daily e-letter covering the equity, commodity, currency, and real estate markets.
Graham also writes Private Wealth Advisory, a monthly investment advisory focusing on the most lucrative investment opportunities the financial markets have to offer. Graham understands the big picture from both a macro-economic and capital in/outflow perspective. He translates his understanding into finding trends and undervalued investment opportunities months before the markets catch on: the Private Wealth Advisory portfolio has outperformed the S&P 500 three of the last five years, including a 7% return in 2008 vs. a 37% loss for the S&P 500.
Previously, Graham worked as a Senior Financial Analyst covering global markets for several investment firms in the Mid-Atlantic region. He’s lived and performed research in Europe, Asia, the Middle East, and the United States.
© 2010 Copyright Graham Summers - All Rights Reserved
Disclaimer: The above is a matter of opinion provided for general information purposes only and is not intended as investment advice. Information and analysis above are derived from sources and utilising methods believed to be reliable, but we cannot accept responsibility for any losses you may incur as a result of this analysis. Individuals should consult with their personal financial advisors.
Graham Summers Archive |
© 2005-2022 http://www.MarketOracle.co.uk - The Market Oracle is a FREE Daily Financial Markets Analysis & Forecasting online publication.