Gold and Silver Bull Market Progress Report
Commodities / Gold and Silver 2010 May 31, 2010 - 10:53 AM GMTBy: Peter_Degraaf
 The debate currently taking place between gold bulls and gold bears is whether or not the central banks of the world are adding to the money supply of the world, or if money supply is contracting.
If bankers are increasing the supply, then the price of gold will rise in terms of this inflated money, (although gold does not really rise in price, it simply holds its value while fiat money loses value, thereby giving the appearance of rising).
One way to determine whether or not money supply is increasing is to look for reasons why the money supply would be increasing. This is because we are not sure if we can trust governments to tell us ‘the truth, the whole truth and nothing but the truth’ when they publish their reports. We know for sure the US CPI and unemployment reports are continually ‘under-reported’, so why not the money supply? After all the FED refuses to open its books to Congress.
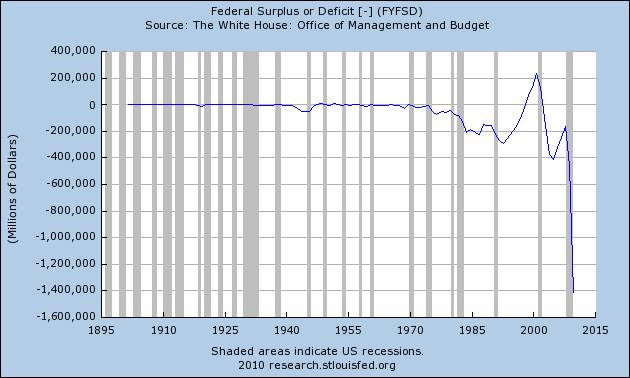
This chart courtesy Federal Reserve Bank of St. Louis shows the US government is running the worst deficits in more than 100 years. If the Federal Government were a family or a business faced with this kind of a deficit it would have to reduce spending and increase revenue or go bankrupt. A family or business has no other options. (Borrowing money only delays the inevitable).
The US government, along with many other governments, decided years ago that they would not consider a reduction in spending. The most important goal for the average politician is to get re-elected. Spending keeps the voters happy and happy voters tend to re-elect.
“When plunder becomes a way of life for a group of men in a society, over the course of time they create for themselves a legal system that authorizes it and a moral code that glorifies it."
Frederic Bastiat.
The central banks oblige the politicians by printing the money and then loaning it to the government so the politicians can spend it.
Since we cannot count on governments to reign in spending, would it be possible for them to increase revenue in order to reduce the deficit?
Historically governments almost always raise taxes when they can justify it to the voters by claiming: “we have no other options”, or “it’s for the good of the country.” Unfortunately a deficit as large as the one facing the US and a dozen other countries cannot be covered by increased taxation.
Since governments have the ability to print money (an option not available to families and businesses), we can reach the conclusion that governments will continue to print money. To stop doing so would mean the end of a lucrative career for a good many politicians who have never had a job outside of public service.
Since the financial problems facing the US and Europe cannot be solved without extreme and unpopular hardships, and since the ‘solution’ to this point has been to ‘print baby print’, we can be almost certain that the printing presses will continue to ‘print away’.
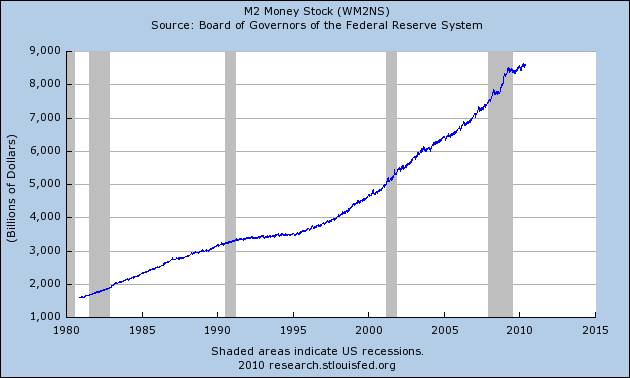
This chart courtesy Federal Reserve Bank of St. Louis indicates that the M2 money supply continues to rise almost exponentially. In view of the fact that the CPI and unemployment numbers are ‘massaged’, it is possible that the actual M2 might even be greater than 8.5 trillion. Whenever Mr. Bernanke is asked “who got the TARP money”, he refuses to give a specific answer.
“The Central Bank is an institution of the most deadly hostility existing against the Principles and form of our Constitution. I am an enemy to all banks discounting bills or notes for anything but coin. If the American people allow private banks to control the issuance of their currency, first by inflation, then by deflation the banks and corporations that grow up around them will deprive the people of all their property, until their children will wake up homeless on the continent their Fathers conquered.”
Thomas Jefferson.
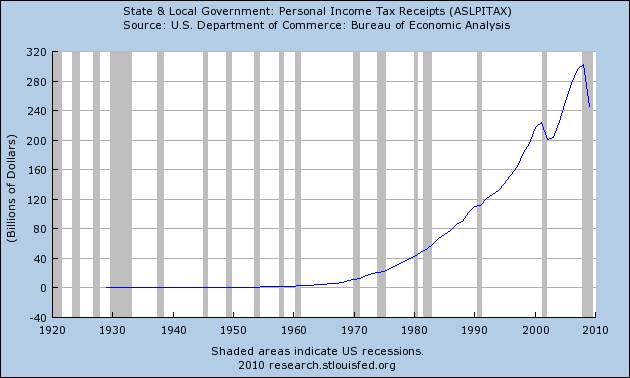
This chart courtesy Federal Reserve Bank of St. Louis shows state and local tax receipts to be in freefall. As long as weekly first time unemployment compensation claims remain above 400,000 and businesses continue to contract, this trend is not likely to turn back up any time soon.
Although this chart covers only state and local taxes, the trend in federal tax take is very similar.
Meanwhile the demand for social services from the Federal Government is increasing, acting like a two-edged sword (see below).
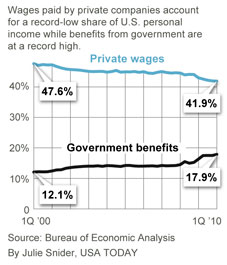
This chart courtesy Julie Snider at USA Today, shows a definite trend toward the ‘two-edged sword’ referred to above. Both the 41.9% and 17.9% are records! A cynic might say that this is a rush toward socialism – more government and less private enterprise.
We can draw the following conclusions:
• Spending by the various governments is ongoing, as the will to stop is (not yet) evident.
• The deficits are huge and growing.
• The point of no return (cut spending and increase revenue) is now behind us.
• ‘A trend is motion remains in motion till it is stopped’.
• That trend is: borrow and print.
• Until we see evidence that the ‘trend in motion’ has been stopped, gold and silver will continue to rise.
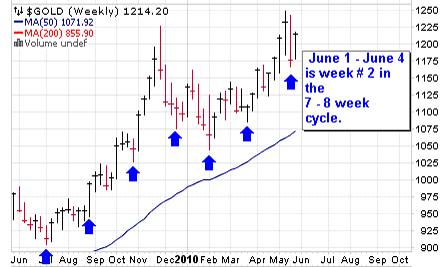
Featured is the weekly gold chart. The blue arrows point to bottoms in the 7 – 8 week gold cycle. This coming week is week # 2 in the 7 – 8 week gold cycle. The peak in the cycle most often occurs during week # 4 (36% of the time), followed by week #3 (27% of the time). The peak in the cycle just past reached a top during week # 7
The Gold Direction Indicator rose to 76% Friday compared to 70% Thursday and 71% Wednesday. When the GDI rises this high it usually means we are closing in on a spot where commercials take profits. That might happen at (subscribers). Since we are early in the 7 – 8 week cycle this will simply be a ‘bump in the road’.
Support for gold is (subscribers), with resistance at (subscribers).
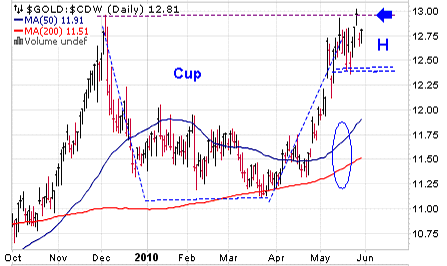
Featured is the gold price in Canadian dollars. Price is carving out a bullish ‘cup with handle’ formation. A breakout at the blue arrow will lead to a target at (subscribers). The 50D is in positive alignment to the 200D (blue oval), and both are rising.
Canadians might think they are not in danger, but the Canadian government sold its gold reserves (38 billion dollars worth) when gold was cheap and invested the proceeds in US Treasury bills. There is nothing backing the Loonie, and if the Greenback drops in value, the Loonie is likely to follow.
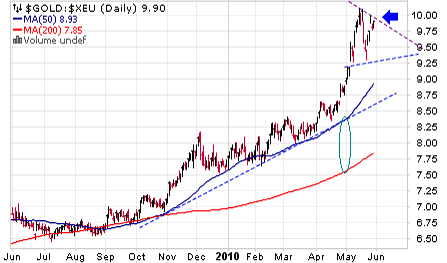
Featured is the gold price in Euros. Price is carving out a bullish pennant. A breakout at the blue arrow will have a target at (subscribers).
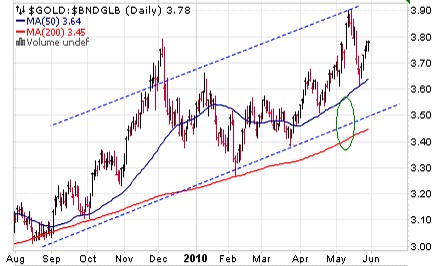
Featured is the index that compares gold to the ‘bonds of the world’ (stuff vs. fluff). The trend is up and the 50D is in positive alignment to the 200D (green oval). The trend is ‘up, up and away.’
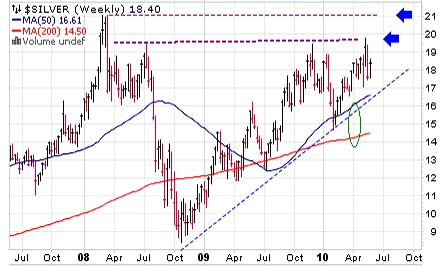
Featured is the weekly silver chart. The pattern is a very bullish Advancing Right Angled Triangle formation. It predicts a coming breakout, possibly at 20.00 and almost for sure at 21.00 with a target at (subscribers). The 50D is in positive alignment to the 200D (green oval), and both are rising. Once price breaks out above 21.00 we’ll see some daily moves of +1.00. Ideally this breakout would wait till late summer, as it would then coincide with the annual ‘Christmas rally’, but it could occur almost any time.
“The American Republic will endure until the day Congress discovers that it can bribe the public with the public's money.”
Alexis de Tocqueville.
Summary:
More and more people (worldwide) are becoming aware of the fact that ‘all is not well’ with the financial system. Fraud and corruption are evident in government and the banking industry. Gold will be seen as a beacon of safety. Recently in Greece people were willing to convert paper money for gold sovereigns at $399.00 ea, (the equivalent of $1,700.00 US dollars per ounce).
The bull market in gold is barely underway and will move higher for many years!
Happy trading!
By Peter Degraaf
Peter Degraaf is an on-line stock trader with over 50 years of investing experience. He issues a weekend report on the markets for his many subscribers. For a sample issue send him an E-mail at itiswell@cogeco.net , or visit his website at www.pdegraaf.com where you will find many long-term charts, as well as an interesting collection of Worthwhile Quotes that make for fascinating reading.
© 2010 Copyright Peter Degraaf - All Rights Reserved
DISCLAIMER: Please do your own due diligence. I am NOT responsible for your trading decisions.
Peter Degraaf Archive |
© 2005-2022 http://www.MarketOracle.co.uk - The Market Oracle is a FREE Daily Financial Markets Analysis & Forecasting online publication.


