


SPX Establishes Lower Low As China Stocks Reverse Higher
Stock-Markets / Financial Markets 2010 May 30, 2010 - 12:04 PM GMT

 FDIC Friday anticipates a Summer break. - The FDIC Failed Bank List announced five new bank closures this week. And I thought the
examiners would have a long vacation over the Memorial Day weekend! Weiss Ratings just
published their list of weakest banks.
FDIC Friday anticipates a Summer break. - The FDIC Failed Bank List announced five new bank closures this week. And I thought the
examiners would have a long vacation over the Memorial Day weekend! Weiss Ratings just
published their list of weakest banks.
U.S. Stocks, Oil, Euro Tumble as Treasuries Rally on Spain - U.S. stocks slid, capping the worst May for the Dow Jones Industrial Average since 1940, while the euro slumped and Treasuries rose as a downgrade of Spain’s debt rating and escalating tensions on the Korean peninsula triggered a flight from riskier assets.
The Dow tumbled 122.36 points, or 1.2 percent, to 10,136.63 at 4 p.m. in New York and lost 7.9 percent this month. The Standard & Poor’s 500 Index sank 1.2 percent to 1,089.41, led by financial shares on the Spanish downgrade and energy companies after U.S. President Barack Obama extended a moratorium on new deep-water drilling. Oil erased gains after rallying as much as 1.6 percent to more than $75 a barrel. Ten-year Treasury yields decreased 7 basis points to 3.3 percent. The euro slipped 0.7 percent to $1.2273.
A Continent Of Lies And Broken Promises - Openeurope.org.uk has put together a paper of the most blatant half-truths, propaganda, and outright lies, abused by Europe not only over the past month, but also over the past 10 years, for the entire duration of the now rapidly collapsing eurozone experiment. As the paper notes: "More than ten years since the euro was launched, and with the single currency facing its greatest ever crisis, the parameters have radically changed. Amid all the uncertainty, one thing has become painfully clear: the EU elite simply got it wrong on the euro."
The VIX pulls back, ready for next attack out of the megaphone.
 --The VIX pulled back within its
Broadening Formation this week.
It remained above its 10-week
moving average at 25.28. The
pullback took longer than expected,
due to the approach of the
Memorial Day weekend.
--The VIX pulled back within its
Broadening Formation this week.
It remained above its 10-week
moving average at 25.28. The
pullback took longer than expected,
due to the approach of the
Memorial Day weekend.
The setup appears as an inside week, a time of indecision, while the VIX gathers strength for the next onslaught.
The NYSE (weekly) Hi-Lo index rose to 11, but remained in bearish territory for the week. The percentage of stocks selling above their 50-day moving average rose from 8 to 17.20 this week, but also remains in bearish territory.
The SPX establishes a lower low.
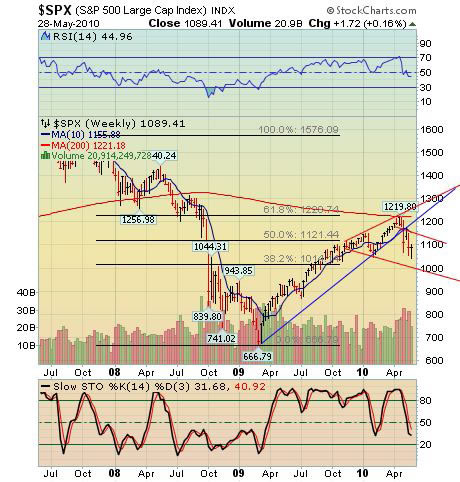 --The SPX made yet a second low
below its “flash crash” low this
week. I had expected the SPX to
close at or near its retracement high,
but some big money pulled the
trigger and sold in the last 20 minutes
of the session. What a turnaround!
--The SPX made yet a second low
below its “flash crash” low this
week. I had expected the SPX to
close at or near its retracement high,
but some big money pulled the
trigger and sold in the last 20 minutes
of the session. What a turnaround!
You are looking at a very bearish pattern in the SPX. The new lows from May 6th have firmly established a new downtrend. It’s time to prepare for a multiple month decline lasting through August to November.
The setup is so bearish that I expect to see another “flash crash” of even greater magnitude on Tuesday or Wednesday.
The NDX did not go lower.
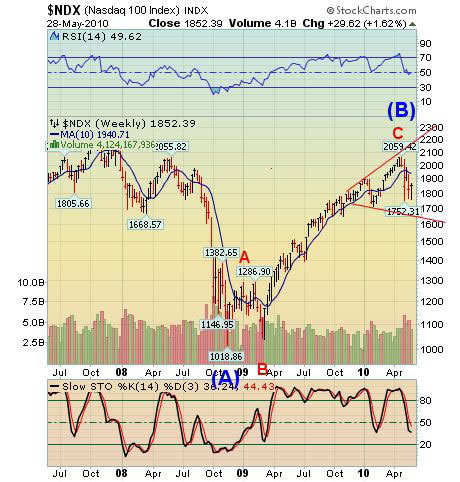 --The NDX is still hesitant to take
out its “flash crash” low. The bounce
closed the week near the top of the
range that I had suggested last
weekend. The most powerful phase
of the decline, including the potential
for a market closure, lies directly
ahead of us. Unfortunately, the more
positive looking profile in the NDX
means that there will be more
investors caught in the downdraft
when the trap door swings open.
--The NDX is still hesitant to take
out its “flash crash” low. The bounce
closed the week near the top of the
range that I had suggested last
weekend. The most powerful phase
of the decline, including the potential
for a market closure, lies directly
ahead of us. Unfortunately, the more
positive looking profile in the NDX
means that there will be more
investors caught in the downdraft
when the trap door swings open.
This setup reminds me of the close on Friday, October 3, 2008. The NDX closed at 1470. The following Monday it opened at 1426. This time the market has the advantage (for the bears) of a three-day weekend.
Gold has begun its final ascent.
 -- Gold appears to have begun its
wave (v) of 5, its final surge before
its collapse. It has multiple targets
that it may achieve. On this chart,
for example, cycle wave (v) equals
cycle wave (i) at 1370. On the
Super cycle chart, Cycle wave (5)
equals Cycle wave (1) at 1350. The
H&S target is a more modest 1295.
On the bearish side, a drop below
1170 calls for a broken uptrend and
collapse.
-- Gold appears to have begun its
wave (v) of 5, its final surge before
its collapse. It has multiple targets
that it may achieve. On this chart,
for example, cycle wave (v) equals
cycle wave (i) at 1370. On the
Super cycle chart, Cycle wave (5)
equals Cycle wave (1) at 1350. The
H&S target is a more modest 1295.
On the bearish side, a drop below
1170 calls for a broken uptrend and
collapse.
The top view as long as the rally remains intact is that the rally may continue beyond 1300.
Oil makes a final retracement prior to its crash.
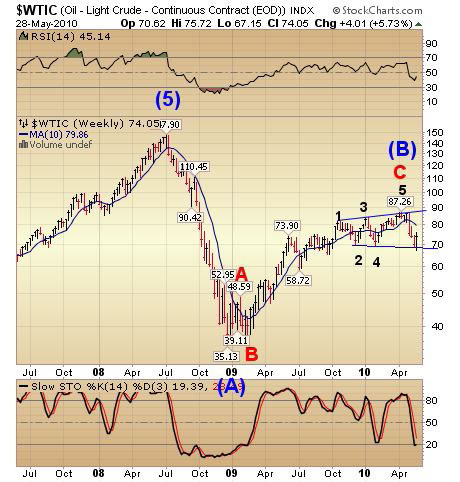 Last week I had mentioned that
$WTIC had met the bottom trendline
of its Broadening Formation (as has
USO), and predicted more downside
before this decline is finished.
Although the bottom trendline of the
Broadening Formation is not
generally viewed as strong support
for a bounce, the cycle timing was
such that it happened anyway.
Last week I had mentioned that
$WTIC had met the bottom trendline
of its Broadening Formation (as has
USO), and predicted more downside
before this decline is finished.
Although the bottom trendline of the
Broadening Formation is not
generally viewed as strong support
for a bounce, the cycle timing was
such that it happened anyway.
That has altered my view only to a small degree, since a very sharp and large decline is now upon us in oil as well. If we view this as a complex head and shoulders pattern, with this week’s action representing the right shoulder, the next target is 49. This agrees with the average decline from a broadening top falling in the area of 50-52.
The Bank Index decline gains momentum.
 Despite the rally earlier this week,
the $BKX is beginning to gain
momentum to the downside with a
lower weekly close.
Despite the rally earlier this week,
the $BKX is beginning to gain
momentum to the downside with a
lower weekly close.
Remember that the $BKX is one of the leading sectors in this decline.
Because of that, I am more bearish on it than the $SPX, for example. The next target for $BKX is 32, provided it does not extend. That means that the BKX as well as the other indices (except gold) will have all fallen to the bottom trendline or below their Broadening Top formations.
The Shanghai Index appears to have reversed.
 --The Shanghai Index appears to be
in the early stages of a major reversal
to one of the retracement targets
above 3500. You may recall that I
had been suggesting for the past two
weeks that a pivot window was open
for a major reversal in FXI and
$SSEC. The pivot actually occurred
on May 21st, two weeks beyond my
“perfect turn” date. An inversion of
the Shanghai market to the U.S.
equities poses an interesting
question. Could it be that some
event may trigger a flow of money
from the U.S. to China? I am still
waiting for the answer.
--The Shanghai Index appears to be
in the early stages of a major reversal
to one of the retracement targets
above 3500. You may recall that I
had been suggesting for the past two
weeks that a pivot window was open
for a major reversal in FXI and
$SSEC. The pivot actually occurred
on May 21st, two weeks beyond my
“perfect turn” date. An inversion of
the Shanghai market to the U.S.
equities poses an interesting
question. Could it be that some
event may trigger a flow of money
from the U.S. to China? I am still
waiting for the answer.
$USB may have one more surge to higher ground.
 -- $USB may need one more push
higher to complete its pattern.
I put the Fibonacci lines on the chart to
show two things. First, this rally is a
retracement and not a surge to new
highs. Second, the 61.8% retracement
agrees with the upper resistance given
by my cycle model. While we
shouldn’t underestimate this rally, we
should also start to formulate an exit
strategy. The pivots allow another
week of rally, but soon we may see a
rotation back into stocks as bargain
hunters look at oversold markets.
China, perhaps?
-- $USB may need one more push
higher to complete its pattern.
I put the Fibonacci lines on the chart to
show two things. First, this rally is a
retracement and not a surge to new
highs. Second, the 61.8% retracement
agrees with the upper resistance given
by my cycle model. While we
shouldn’t underestimate this rally, we
should also start to formulate an exit
strategy. The pivots allow another
week of rally, but soon we may see a
rotation back into stocks as bargain
hunters look at oversold markets.
China, perhaps?
$USD is impulsing higher.
 -- $USD appears to have begun a
probable wave iii of (iii) of 3, which
should stretch to its Head and
Shoulders target at 89.75. It appears
that the weekly push that I had
anticipated last week has occurred
and retraced, making it ready for a
much larger push higher next week.
-- $USD appears to have begun a
probable wave iii of (iii) of 3, which
should stretch to its Head and
Shoulders target at 89.75. It appears
that the weekly push that I had
anticipated last week has occurred
and retraced, making it ready for a
much larger push higher next week.
The next pivot in UUP is scheduled for Wednesday, which may be a lesser cycle peak for the $USD.
I hope you all have a wonderful
weekend!
Regards,
Tony
Traders alert: The Practical Investor is currently offering the daily Inner Circle Newsletter to new subscribers. Contact us at tpi@thepracticalinvestor.com for a free sample newsletter and subscription information.
Our Investment Advisor Registration is on the Web
We are in the process of updating our website at www.thepracticalinvestor.com to have more information on our services. Log on and click on Advisor Registration to get more details.
If you are a client or wish to become one, please make an appointment to discuss our investment strategies by calling Connie or Tony at (517) 699-1554, ext 10 or 11. Or e-mail us at tpi@thepracticalinvestor.com .
Anthony M. Cherniawski, President and CIO http://www.thepracticalinvestor.com
As a State Registered Investment Advisor, The Practical Investor (TPI) manages private client investment portfolios using a proprietary investment strategy created by Chief Investment Officer Tony Cherniawski. Throughout 2000-01, when many investors felt the pain of double digit market losses, TPI successfully navigated the choppy investment waters, creating a profit for our private investment clients. With a focus on preserving assets and capitalizing on opportunities, TPI clients benefited greatly from the TPI strategies, allowing them to stay on track with their life goals
Disclaimer: The content in this article is written for educational and informational purposes only. There is no offer or recommendation to buy or sell any security and no information contained here should be interpreted or construed as investment advice. Do you own due diligence as the information in this article is the opinion of Anthony M. Cherniawski and subject to change without notice.
Anthony M. Cherniawski Archive |
© 2005-2022 http://www.MarketOracle.co.uk - The Market Oracle is a FREE Daily Financial Markets Analysis & Forecasting online publication.