


How Post Stock Market Panic Bottoms Form
Stock-Markets / Stock Markets 2010 May 28, 2010 - 11:48 AM GMTBy: Clif_Droke

 Many traders want to know if the market is undergoing a bottoming process or if it's rather setting up for a fresh decline to lower lows. We’ll attempt to provide an answer to that question in this commentary.
When we're dealing with the stock market we're always dealing with best "guesstimates" which means there can never been absolute certainty regarding the market's intent. Technical analysis allows us to follow the path of least resistance when internal momentum is accelerating and the market is trending higher (or vice versa) and it can often tell us when the market is being set up for a reversal of trend. But what of those periods -- like now -- when the market has undergone a sharp decline, loses internal momentum, yet shows no clear directional bias? In cases like this the internal momentum indicators are of little value. The cycles can be useful but ultimately cannot guarantee the market's next directional move since it requires velocity to get the movement started.
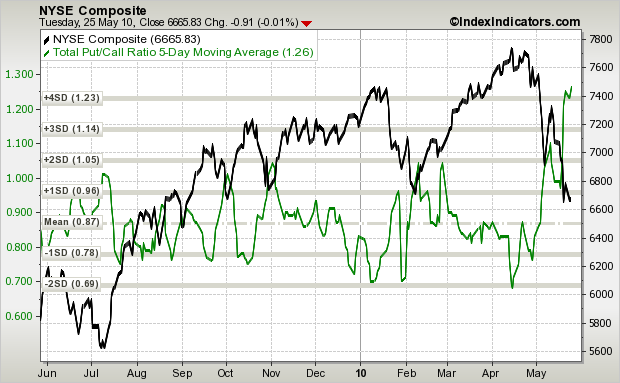
In such cases the most important thing we can look to is stock market psychology. We know that the market's chief goal is to separate investors from their money, which is why the market typically does the opposite of what the majority of investors believe it will do. Investor sentiment following a market panic tells us whether the average market participant is hopeful and optimistic that the market will soon recover after a steep decline (which is bearish from a contrarian standpoint). It can also tell us to expect a recovery after a panic if the public is pessimistic regarding the market's recovery potential. When the public begins to sell short and buy put options according to the various put/call ratios, it tends to built a heavy short interest from which the market can launch a short-covering rally (to the great surprise of the public).
The CBOE put/call ratio tells us the public is still overly bearish following the panic of two weeks ago. There's hardly a bull among the retail investor crowd right now, which supports the stock market's "wall of worry." And even the volatile AAII investor sentiment poll is net neutral with only 36 percent of investors expressing any bullish sentiment against a 36 percent bearish sentiment.
Moreover, the number of stocks making new 52-week lows has been contracting in recent days since the selling panic, indicating a diminution of internal selling pressure. This is important following a huge decline, for if the new lows were to remain stubbornly high for several consecutive days it would mean the market is more than likely setting up for another decline.
The next best thing we can do to tell us what we might expect following a selling panic is to observe the market's action following previous declines when the technical and psychological indications were similar to today. One of the closest parallels I can find is the news-related selling panic of late February 2007. We discussed this in a previous report but I think it's worth a closer look since it's typical of what happens following a panic. The market usually needs at least three weeks of consolidation after a steep decline before it's ready to break out again and confirm a buy signal relative to the 15-day moving average.
Following the late February '07 sell-off, the SPX didn't confirm a buy until three weeks after the panic. If the February '07 panic is any guide (and I think it probably is), we can expect to see the SPX confirming a breakout fairly soon. The important thing to monitor for now is the number of stocks making new 52-week lows and the investor sentiment polls and put/call ratios.
Gold mining stocks
Concerning the mining stock outlook, we previously questioned the negative divergence signal that our old, trusty leading indicator stock Freeport-McMoRan Copper & Gold (FCX) was sending in April and earlier May. While the XAU index continued to trend higher, FCX and other leading indicator stocks were in a steady decline. Ordinarily the lag between the divergences in FCX and the XAU index doesn’t last more than a few days but in this case it lasted nearly six weeks. Alas, FCX and the other leading indicator stocks were telling the truth as it turned out as finally the gold and silver stocks comprising the XAU collapsed along with the broad market two weeks ago.
It stands to reason that as Freeport was among the first of the important leading stocks to go into decline back in April, it should be among the first to bottom out and turn up again ahead of the XAU components. Already we have a preliminary sign beginning on Friday, May 21, that FCX may be on the verge of reversing its immediate-term downtrend. A confirmed breakout above the 15-day moving average (blue line) for FCX would confirm that the downtrend has been broken and would also be a bullish leading signal for the XAU.
Chart pattern trading techniques
The ability to read chart patterns is one of the most important skills a trader or investor can own. By a skillful application of chart reading methods, you eliminate the need for countless hours of scouring the balance sheets of companies for potential investment quality stocks. Good chart reading skills empower you to focus on stocks that have the best prospects for generating investment returns for short- or intermediate-term trading. For those with a fundamental approach, basic chart reading skills can also give you a “leg up” in identifying stocks with investment quality potential, which can then be supplemented by sound fundamental analysis.
While there are many resources available for learning how to read chart patterns, most are just repetitions of the simplistic techniques taught by the pioneers of technical market analysis, Edwards & Magee. This basic form of chart reading is a good place to start, but it won’t enable you to achieve maximum success in selecting the highest returning trading opportunities in the stock market. For that, you need something extra, namely the ability to gauge whether the stock you wish to trade has internal momentum in its favor or not. This is the “missing ingredient” in most forms of chart pattern analysis and it explains why most chart readers experience only sporadic success at best.
In my book, “How to Read Chart Patterns for Greater Profits,” I explain how to make internal momentum work for you and how to integrate momentum analysis with sound chart reading techniques. The techniques revealed in this book will put you in the driver’s seat and will help you to profit from the many opportunities awaiting you in the financial markets. Stock trading is a sure road to achieving capital gains, but only if you know how to read and act on the market’s signals. “How to Read Chart Patterns for Greater Profits” will put you on the path to success in the market and will give you a huge advantage over the average trader.
The book was written so that retail traders might be able to understand and practically apply these useful methods of market analysis. The book is now available for sale at:http://www.clifdroke.com/books/readingchartpatterns.mgi
By Clif Droke
www.clifdroke.com
Clif Droke is the editor of the daily Gold & Silver Stock Report. Published daily since 2002, the report provides forecasts and analysis of the leading gold, silver, uranium and energy stocks from a short-term technical standpoint. He is also the author of numerous books, including 'How to Read Chart Patterns for Greater Profits.' For more information visit www.clifdroke.com
Clif Droke Archive |
© 2005-2022 http://www.MarketOracle.co.uk - The Market Oracle is a FREE Daily Financial Markets Analysis & Forecasting online publication.