The Gold and Silver Precious Metals Correction
Commodities / Gold and Silver 2010 May 27, 2010 - 01:18 AM GMTBy: Chris_Vermeulen

 It’s been an exciting week for traders as volatility levels are through the roof and the broad market is moving up and down like a yoyo. You cannot take your eyes off the screen if you have a large amount of money invested as you can quickly find yourself with a large profit or loss in the matter of minutes….
Although we have seen stocks jump around the past few days precious metals have held strong with very little volatility. This is because of the economic fears looming for the US and other countries of possible financial collapse. This fear is helping to boost gold and silver prices because they are seen as the safe haven. Also we are seeing money move in the US dollar because the country is still seen as a leader in many ways helping to boost the US dollar.
Below are a couple charts on Gold and Silver ETF’s showing the end of last years rally and the correction in prices which are now looking to setting up for another leg higher.
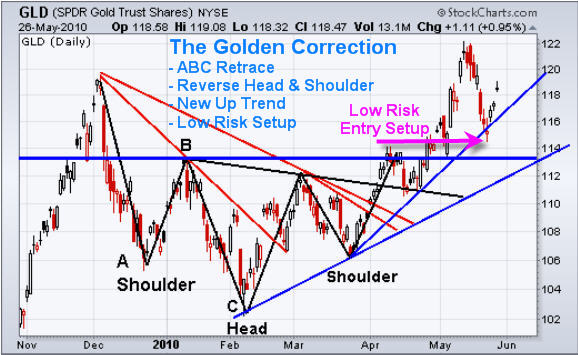
GLD – Gold ETF Trading Vehicle – Daily Chart
I called this chart “The Golden Correction” because it literally is. We saw prices rally late in 2009 finishing off with a parabolic spike which we know is not sustainable and almost always results in a VERY sharp drop. This correction unfolded as planned with an ABC retrace which shakes out weak positions. We then we saw a reverse head & shoulders pattern form which again also shakes out weak positions. Once the neckline was broken from the reverse H & S the new up trend was started providing a couple trading opportunities for us along the way. The most recent low risk entry point can be seen on the chart as gold prices dropped back to a key support level.

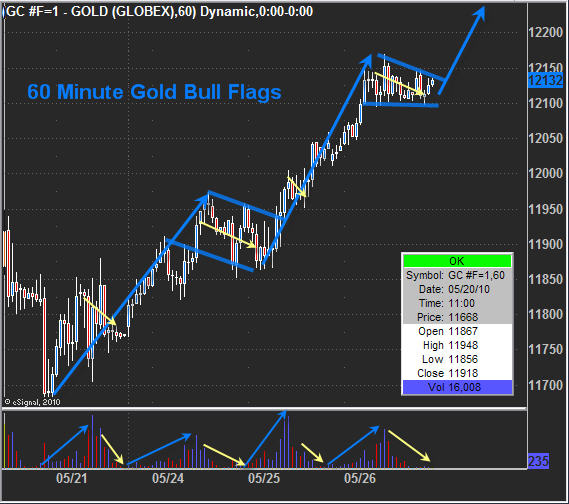
Gold Futures Price – 60 Minute Day Trading Chart
Gold has been showing some very bullish price action the past week forming several mini bull flags with confirming volume levels. I think we should see gold pop another $5-10 bucks in the very near future if not continue higher for several days.

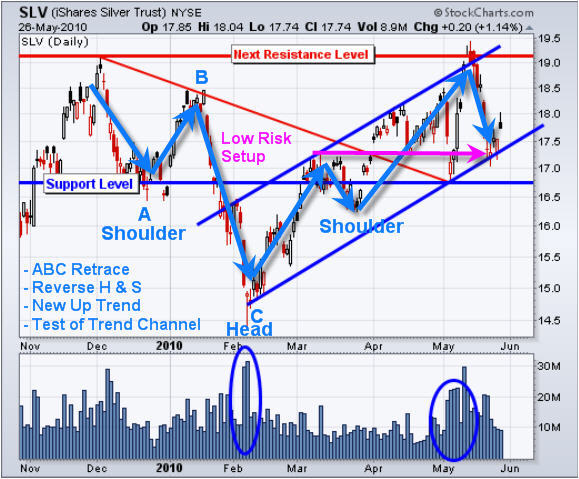
SLV – Silver ETF Trading Vehicle – Daily Chart
Silver formed much of the same patterns as gold but with much more volatility. Also silver has yet to break the 2009 high which is surprising but with a large part of silver being use for industrial purposes it does make sense as the economy is not as strong as it was thought to be in 2009. Silver carries much more risk when trading because it has more random moves and increased volatility.

Mid-Week Precious Metals Trading Conclusion:
In short, gold and silver are in an uptrend and looking strong. Both are currently trading at short term resistance levels on the daily chart which has caused them to stop moving up today (Wednesday May 26th) but on an intraday basis they look solid and could break though these resistance levels.
That being said buying way up here adds a lot more risk because a good chunk of the move has already been made and if prices do roll over and start heading back down the next support level is several percentage points away for placing a protective stop with the proper amount of wiggle room.
If you would like to receive my Real-Time Trading Signals & Trading Education check out my website at www.FuturesTradingSignals.com
By Chris Vermeulen
Chris@TheGoldAndOilGuy.com
Please visit my website for more information. http://www.TheGoldAndOilGuy.com
Chris Vermeulen is Founder of the popular trading site TheGoldAndOilGuy.com. There he shares his highly successful, low-risk trading method. For 6 years Chris has been a leader in teaching others to skillfully trade in gold, oil, and silver in both bull and bear markets. Subscribers to his service depend on Chris' uniquely consistent investment opportunities that carry exceptionally low risk and high return.
This article is intended solely for information purposes. The opinions are those of the author only. Please conduct further research and consult your financial advisor before making any investment/trading decision. No responsibility can be accepted for losses that may result as a consequence of trading on the basis of this analysis.
Chris Vermeulen Archive |
© 2005-2022 http://www.MarketOracle.co.uk - The Market Oracle is a FREE Daily Financial Markets Analysis & Forecasting online publication.


