Silver Bull Market Shows Alarming Technicals
Commodities / Gold & Silver Aug 31, 2007 - 01:57 PM GMTBy: Zeal_LLC
 Commodities and commodities-stock speculators have had quite a rough-and-tumble last full month of summer. In a season where the markets typically hold traders in a mire of malaise, various extraneous events have awoken the volatility beast making for an exciting August.
With general stocks retreating from record-high levels in mid-July, commodities stocks have transcended general stock losses and have temporarily bucked the historically-inverse correlation with general-stock bears. Precious-metals-stock traders in particular have endured a session of wailing and gnashing of teeth. Key tactical support levels of the venerable HUI gold-stock index were sliced through like a warm knife through butter.
But though the commodities stocks have taken some abuse of recent, this fearful selling is seemingly just shaking out the over-leveraged and weak-handed traders. Far too often traders forget that volatile consolidations are par for the course within commodities bulls. All this activity might just be the final rebalancing of sentiment so a powerful new upleg can emerge.
Now though in the last six weeks or so this mini-stock panic has looked like the end of the world for some, the performance of most of the underlying commodities was nowhere near as bad. But the behavior of one commodity in particular, silver, has really riled up many traders.
While gold has weathered this recent stock-market maelstrom rather well, silver's erratic behavior has prompted a number of its long-faithful investors to question its steadfastness. Frankly I was shocked to see some of the wild commentary and distraught inquiries into the supposed perils of this white metal. Let's take a look at what this fuss is all about.

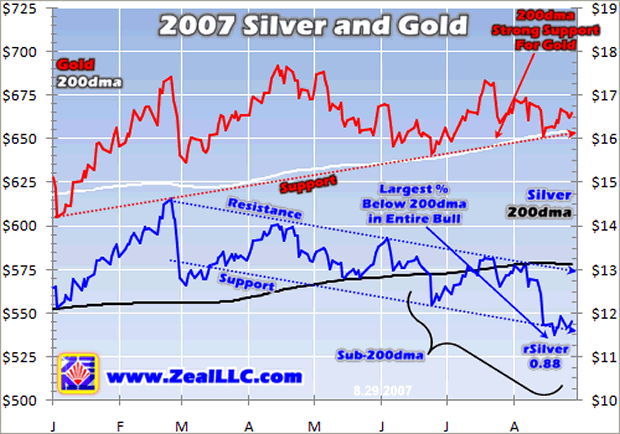
This first chart displays the 2007 performance of gold and silver using daily closing data. As you can see gold has done just fine so far this year showing strong support off its 200-day moving average. The Ancient Metal of Kings is still in the midst of a textbook-perfect uptrend off of its October 2006 low under $570 and has powered 23% higher to its highs earlier this year.
But looking at this chart, the “as goes gold so goes silver” mantra hasn't quite played out of late. And this is why silver traders are up in arms. All this commotion does surprise me though, as experienced and battle-hardened silver traders should understand the white metal's fickleness compared to gold.
Regardless, this short-term chart has many folks scratching their heads. And the apparent technical breakdown of silver over the last several months has miffed even some of the silver elite.
Now the undulations of gold and silver are nearly identical from a quick visual glance, especially if one data set is transposed directly over the other. The differences on both the flows and the ebbs though are in the extremes, when prices move sharply in either direction. And silver's extremes have given its trend a whole different look than gold's.
Whereas gold has been trending up bouncing off its 200dma, silver has been in a six-month downtrend . It has actually spent much of the last couple months at prices below its 200dma. And where gold is currently trading above where it began the year, the price of silver is lower than its opening price.
Even more alarming to silver traders is the depth to which its price had recently fallen below its key 200dma. As measured by percentage, it was the lowest point in its entire bull! Silver's relative weakness has got a lot of attention recently.
This first very-short-term look at silver can indeed paint a somber picture. But the picture that short-term analysis sometimes paints may not always depict prevailing strategic realities. Even the most beautiful cities in the world have slums. But if a slum is the first part of a city you view, the rest won't pique your interest. Perhaps all you need to do is stroll down the street in order to change this initial opinion.
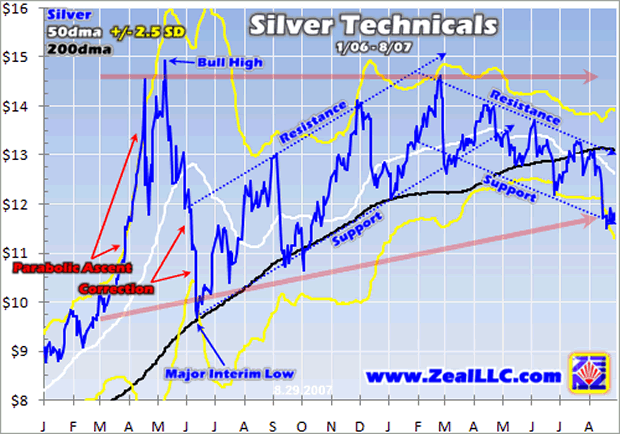
If we zoom out a little and take a look at silver over the last 18 months, things don't look as bleak. This next chart captures silver's bull-to-date high achieved in May of last year. And this latest and most powerful upleg that vaulted the price of silver to nearly $15 occurred in impressive parabolic fashion.

Though futures and stock speculators that were long during this parabola saw legendary gains, those that didn't heed the overbought warning signs were quick to lose much of these gains during the imminent and sharp correction to follow.
At Zeal we rode much of the 2005/2006 upleg and scored fantastic gains for ourselves and our newsletter subscribers. But much to the chagrin of the metals-markets perma-bulls, we saw the writing on the wall for an imminent correction. A correction that was necessary in order to stay the integrity of silver's awesome secular bull and shed excessively greedy sentiment.
And of course the downside of a parabola is never pretty. Parabolas tend to breed equally sharp movements to the downside. And this sharp correction took silver to its June 2006 low under $10, a 35% loss in just 23 trading days. Stocks of course fared much worse.
After this sharp correction it was common perception that silver would either begin its next upleg off its major interim low or enter into a consolidation phase. A sideways consolidation would simply bleed off the resonating euphoria from the previous massive upleg.
Well for a period of about 8 months, it looked as though silver was off to the races as it carved a beautiful upward trend that in late February brought it to within 2% of its bull high less than a year earlier. But in late February the metals and stocks hit a wall, with the Chinese stock-market selloff acting as a catalyst.
Timing-wise, this Chinese stock selloff seemed to mark a turning point for silver. Its uptrend broke and it soon formed a downtrend that we seem to still be in today. But though silver's initial uptrend from its June 2006 low indeed broke, it is important to view this in context and seriously consider the time horizon in question.
This upward trend channel was young, only 8 months old. And support on a less-than-one-year-old trend channel is not only non-secular in nature, but it lacks foundational strength. So giving a different look to this chart, the 8-month uptrend and 6-month-old downtrend can indeed be combined to form a 14-month consolidation.
As of now this consolidation could be drawn as an ascending wedge, illustrated by the transparent red lines. If silver was to drop further though, the support and resistance lines could simply be redrawn to form a horizontal trend channel illustrating a sideways consolidation. And there is quite a bit more wiggle room before silver approaches its major interim low under $10.
Again, it is important to consider this consolidation in the context of time. Though a 14-month consolidation is no fun for investors, let's zoom out yet again to get an even bigger picture of today's consolidation and see how it strategically fits into silver's entire bull.

Charts indeed provide an excellent visual of market conditions, and technical analysis is very useful on many levels. But no two analysts will paint the same exact picture. Charts can be interpreted many different ways and lines can be drawn at various slopes depending on the message that is trying to be relayed.
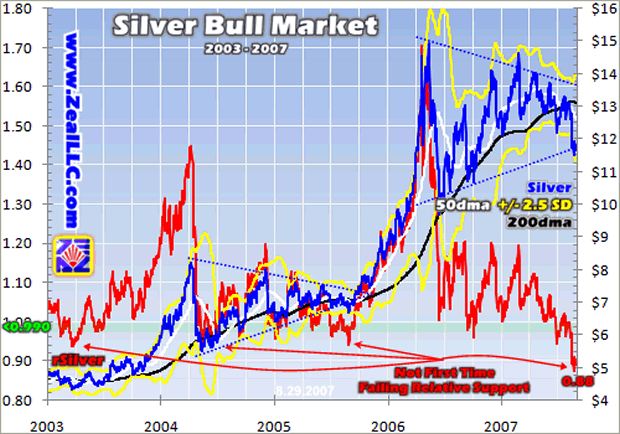
When I look at the big picture of our silver bull to date, I see two massive uplegs capped by parabolic ascents. And these uplegs are followed by two long periods of consolidation led off by sizeable corrections.
The first massive upleg took silver to heights it had not seen since the late 1980s. And after silver reached its 2004 apex just over $8, a long consolidating wedge was formed that lasted for about 18 months before it finally broke out to the upside.
Several times during this 18-month consolidation silver knifed through its relative support zone, or below its 200dma. Relativity is a trading tool we use at Zeal that simply measures where silver is trading relative to its 200dma. I encourage you to read up on relativity if you are not familiar with it.
Now in bull markets, prices tend to soar above their 200dmas in uplegs and retreat to their 200dmas in corrections. This action causes the 200dma to rise on balance during the bull. And even during this 18-month consolidation higher lows indeed caused the 200dma to rise as the price of silver remained high.
Occasionally silver dipped below its 200dma and relative support zone, but as you can see this never lasted too long. Even as silver consolidated to bleed off the greed and prep for the next upleg, its price remained high compared to its lows in previous years. The sub-$5 grind in the years leading up to this upleg were history, as silver's average price throughout the course of this first long consolidation was nearly $7.
These continually rising prices and a rising 200dma cemented the case that silver had followed gold and entered into a secular bull market. This was further reinforced as silver entered into its second massive upleg toward the end of 2005. And this latest upleg was something to behold. The price of silver more than doubled in just 7 months leading to its May 2006 peak near $15!
Well 14+ months later, our current consolidation is starting to look eerily familiar to the previous consolidation that led up to this latest massive upleg. From this higher-level view, I was able to reshape the support and resistance lines from the previous chart and draw a wedge similar to the 2004/2005 consolidation.
Again, today's support failure is not the first time in this bull, or even consolidation, that it has happened. Now the extreme piercing of support I'll admit does warrant some chatter. Panic selling a couple weeks ago brought rSilver to a low point of 0.88, or 88% of its 200dma. This is obviously the lowest point in this entire bull, trumping the previous low achieved in May of 2004.
But what does this new Silver low truly mean? Does it mark the end of this bull market? Is it time to sell? I don't think so! First, let's consider where silver is today. Now judging by the prevailing sentiment, you'd think it was trading at $5 an ounce again. But close to $12 today, silver is still at levels that were unthinkable just a few years ago.
Even looking at this chart you can easily see that this consolidation is flagging on the high side of this latest massive upleg. This is testament alone that the bull is not over. On top of this, silver today is still 170% higher than its 2003 lows and 43% higher than the high from its previous upleg.
Just like gold, silver is still in the first half of a secular bull market that should see it go much higher. I don't know how this lengthy consolidation will turn out or when the next massive upleg will begin, but this recent break in relative support does not damage the integrity of the bull.
Ultimately silver and silver-stock speculators should have come to accept volatility by now. This white metal is by far the more volatile of the PMs as it lies in a speculators' market. Its market is less than a fifth the size of gold, so it doesn't take a lot of capital to move this metal in either direction.
From a fundamental perspective there have been no structural changes to silver's smashingly bullish fundamentals. In fact, silver's fundamentals should continue to buttress the future of this volatile metal and the stocks that will bring it to market today and tomorrow.
Silver's fundamentals today are ultimately the same as they were when its bull began. Suppliers continue to struggle to meet market demand and silver investment continues to rise. In fact, its indispensable industrial applications are still seemingly immune to rising prices. This of course makes sense since only small amounts of silver are used per unit of a finished product. The silver cost per unit is usually trivial compared to total manufacturing costs.
This is supported by a recent GFMS study that marked 2006 as the fifth consecutive up-year for silver's use in industrial applications. This was led by both China and Japan showing greater than 10% year-over-year growth with the US up an impressive 6%. And this all comes on the heels of the major industrial opposition to last year's launch of the famed silver ETF.
SLV has proven to be wildly successful for this silver bull since it went live last spring. So much so that this ETF was a big catalyst to the flurry of speculative excitement that gave fuel to silver's parabolic rise.
The opposition to SLV was afraid that an ETF would reduce the silver on the market and cause prices to rise. In a sense they were right, but the reason their opposition was thwarted by the SEC simply boils down to their selfish ambitions, they want cheap silver. Silver is indeed an industrial metal, but the successful launch of this ETF proves that its precious aspect should not be taken for granted.
The success of SLV has shown that there is a wider market for silver as an investment than originally thought. Since its custodian's initial silver investment of about 21m ounces in April of 2006, the amount of silver in trust has grown to greater than 141m ounces. This is an incredible increase of 570% in just over a year since this ETF went live!
Another report out of GFMS really bolsters silver's fundamentals. This report identifies 10-year growth for world silver fabrication through 2005 of 37% for industrial uses and 61% for coins. And though it shows silver's use in photography down by 22% over this time, there are some interesting facts that come out of this.
Most interesting is that 2005 marked the first time that silver demand for jewelry was greater than its demand in photography. This is important because 60% of the silver used in photography is recycled, whereas a very small amount of silver is recycled from jewelry. Steady jewelry demand and shrinking photography demand can be spun in positive fashion. And because of the differing recycle rates, this trend could end up creating more overall demand for silver.
So with silver's still-excellent fundaments and a technical picture that is not as scary as people think, opportunities still abound for investors. And I believe silver stocks remain the best vehicle for speculation and investment. The explorers, developers and producers tasked with bringing this metal to market offer spectacular leverage to the price of their underlying metal.
But since three-quarters of the silver that comes to market is just byproduct revenue for some of the major global mining conglomerates, it is the other one-quarter that comes from primary silver companies that warrants our capital. These primary silver companies are what stock traders can use to directly leverage silver. They live or die by its secular price trends.
With the abuse that the commodities stocks have taken of recent, silver stocks in particular, there are now excellent buying opportunities available to layer in for the next run-up in silver. At Zeal we periodically publish research reports that among many things help feed our newsletter trades. And this spring we published a report profiling our 20 favorite silver stocks.
In this report are detailed fundamental profiles of the silver stocks we believe have the highest probabilities-for-success to prosper in silver's next upleg. Many of these stocks have been sold off with the markets and are now at or near oversold technically opportune buy points. If you would like to have this valuable report at your fingertips please purchase it today .
The bottom line is though silver appears to be weak, especially compared to gold, this shouldn't come as a surprise due to its hyper-speculative nature. Even with silver in the midst of a mini-downtrend and relative support at a bull record low, there is still no reason to panic.
The uptrend and downtrend that have followed the major interim low off silver's May 2006 top should be considered in strategic context. These separate trends are turning out to just be tactical noise in what is panning out to be a long consolidation similar to the one following silver's first major upleg.
Investors now have the opportunity to become true contrarians and deploy speculative capital into the much-feared silver-stock environment. If silver's last two uplegs and consolidations tell the story of what is to come, then legendary gains could be just around the corner.
By Scott Wright
So how can you profit from this information? We publish an acclaimed monthly newsletter, Zeal Intelligence , that details exactly what we are doing in terms of actual stock and options trading based on all the lessons we have learned in our market research as well as provides in-depth market analysis and commentary. Please consider joining us each month at … www.zealllc.com/subscribe.htm
Thoughts, comments, or flames? Fire away at scottq@zealllc.com . Depending on the volume of feedback I may not have time to respond personally, but I will read all messages. Thanks!
Copyright 2000 - 2007 Zeal Research ( www.ZealLLC.com )
Zeal_LLC Archive |
© 2005-2022 http://www.MarketOracle.co.uk - The Market Oracle is a FREE Daily Financial Markets Analysis & Forecasting online publication.


