Stock Market Topping Continues, Beware of Any Short-Term Rallies!
Stock-Markets / Stock Markets 2010 May 26, 2010 - 08:10 AM GMTBy: Claus_Vogt
 Things have changed rather quickly for the stock market. Up until two weeks ago it was very difficult for a technical analyst to make a bearish argument. All over the world the big indexes were trending upwards, exhibiting no signs of technical weakness.
Trend-following indicators were rising, too. And indicators based on market breadth, like the advance-decline line and the number of stocks making 52-week highs or lows, were healthy. Last but not least the chart patterns showed no signs of deterioration.
To uncover any clues that risks had grown considerably, you had to look at indicators outside the realm of technical analysis …
Especially worrisome were monetary and sentiment indicators. Money supply had stopped increasing. Hence liquidity was drying up.
At the same time fund managers became more bullish than ever before …
 |
| Fund managers are almost out of cash. |
A few short weeks ago mutual fund cash levels reached a record low of 3.4 percent, according to Jason Goepfert, president of SentimenTrader.com. The old record of 3.5 percent was set in the summer of 2007 at the very end of a cyclical bull market off the 2003 lows.
Back then it took fund managers 4½ years to get fully invested. But since the panic lows of March 2009, they only needed one year to accomplish the same thing!
The Chart Pattern Is Clear
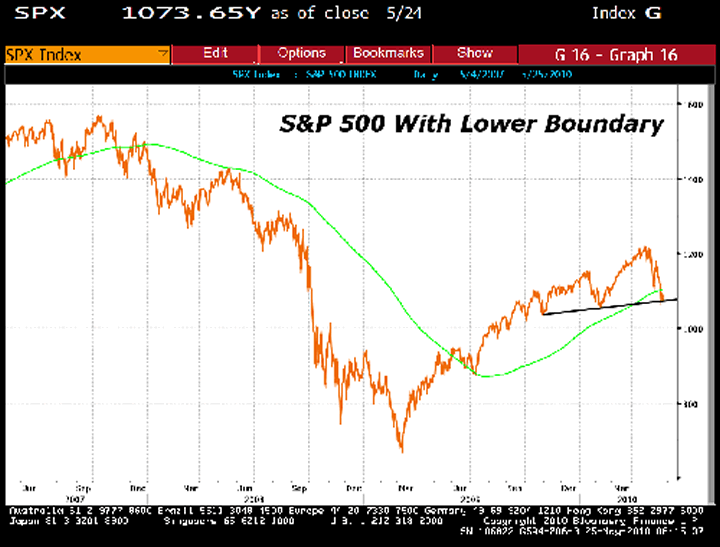
What are all these indicators telling us now after last week’s stock market plunge? Well, valuation is still very high, and monetary indicators are clearly negative for stocks.
Longer-term sentiment indicators haven’t changed for the better. And the charts are showing very ominous patterns — patterns that look like potential topping formations.
In the chart of the S&P 500 below I’ve drawn the lower boundary of that potential topping formation. This picture is as clear as it gets: If prices break below this lower boundary, the huge rally off the March 2009 low is over and the bear market is back.

Source: Bloomberg
When Will the Breakout Occur? Or Perhaps It Won’t …
I say that because a topping formation is not confirmed until prices break below the lower boundary.
If prices don’t fall below the lower boundary, then the potential topping formation is either taking more time to play out, or it may turn out to be a frightening consolidation during an ongoing bull run.
Right now the arguments for an eventual — rather than an immediate — breakout are solid. The above mentioned valuation, monetary, and sentiment indicators strongly argue against a continuation of this huge rally off the March 2009 lows. But the technical indicators haven’t sounded the alarm yet.
Rarely do bear markets begin without a marked deterioration of market breadth or a tiring of trend-following indictors. Therefore, the scenario of an immediate market plunge is unlikely, especially since momentum indicators are extremely oversold right now.
They seem to say that a short-term rally could soon start from current levels. During such a rally the still missing technical deterioration could easily develop.
In an ideal scenario prices would rise back to token new highs, unconfirmed by the breadth indicators, to finally signal the end of this medium-term up trend, which in the bigger picture is nothing more than a huge bear market rally anyway.
Best wishes,
Claus
This investment news is brought to you by Money and Markets. Money and Markets is a free daily investment newsletter from Martin D. Weiss and Weiss Research analysts offering the latest investing news and financial insights for the stock market, including tips and advice on investing in gold, energy and oil. Dr. Weiss is a leader in the fields of investing, interest rates, financial safety and economic forecasting. To view archives or subscribe, visit http://www.moneyandmarkets.com.
© 2005-2022 http://www.MarketOracle.co.uk - The Market Oracle is a FREE Daily Financial Markets Analysis & Forecasting online publication.


