Conservative Equity Income Investment Filter
Stock-Markets / Investing 2010 May 24, 2010 - 09:45 AM GMTBy: Richard_Shaw
 Equity income is important to most investors who have substantially completed the savings stage of life, and who expect to rely on those assets to maintain lifestyle. While bonds are important to portfolios, they do not provide growth of income. Some level of income growth (equity income) is essential to those investors who expect to pay for lifestyle with investment income.
Probably, a portfolio of well selected equity income stocks assembled over a period of item could greatly reduce the need for or even appeal of bonds in the portfolio (so long as the investor can live on the income without invading capital, and so long as the investor can sleep when the capital values fluctuate widely, instead focusing on the steadiness of the dividend income).
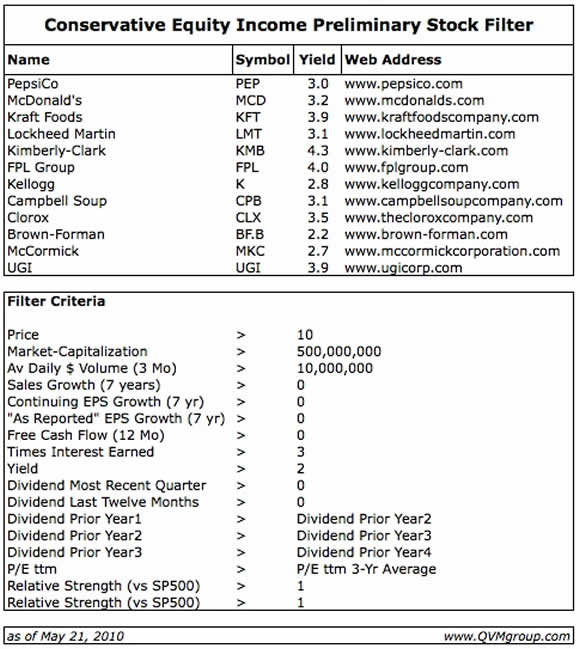
For those who may be thinking in those terms, here is one list of twelve stocks that pass one version of what we think is a conservative equity income filter.
There certainly are higher yielding opportunities, particularly in assets such as natural resource royalty trusts and pipelines. We like them too.. Taxable bonds may pay more, but they don't increase income. Municipal bonds avoid (at least for now) the 2011 increase in taxes on investment income, but they may create corresponding credit risk (is California the next Greece?). High yield (below investment grade bonds) have substantial yields, but they definitely have corresponding credit risk.
The filter we did today, was intended to find financially sound and growing companies, that investors have recently rated as solid, as indicated price relative strength (price performance versus the S&P 500 index).
From a stock database of 8,883 stocks, using data as of the close of business last Friday (May 21, 2010), twelve stocks passed the filter criteria presented in the lower half of the table image.

Keep in mind that qualitative filtering can result in significantly different lists with sometimes minor changes in filter criteria. Here is a general description of how this filter reduced the list:
- We began with a universe of 8,883 stocks that traded on Friday.
- After applying the first six criteria for size, liquidity and growth; the universe was reduced to 850 stocks (about 10% of the initial universe)
- By adding positive free cash flow and solid times interest coverage, the list reduced by nearly half to 470
- When a 2% yield requirement was added, nearly 3/4 of the list fell away leaving 125 companies
- By adding a minimum 3-year YOY dividend growth, the list reduced to 82 companies
- The requirement that the P/E be less than the 3-year average cut the list to 47 companies
- Lastly, by asking for better price performance than the S&P 500 for 4 and 13 weeks, we ended up with 12 companies.
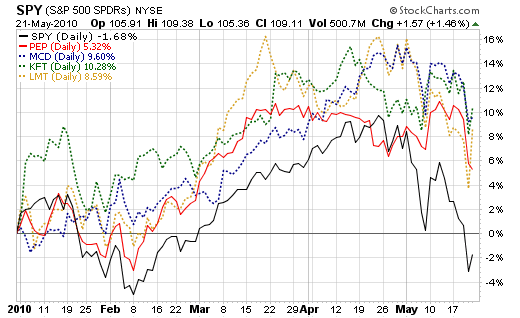
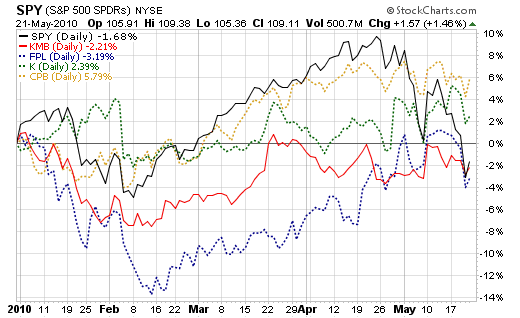
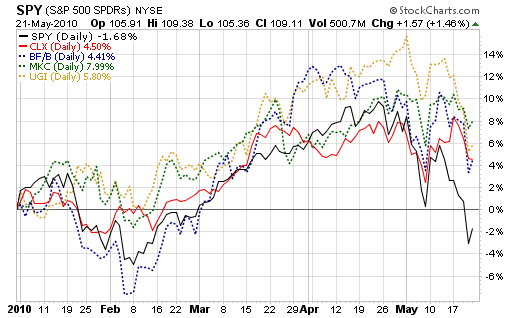
Here are one-year charts comparing performance of the twelve stocks to SPY (proxy for S&P 500). Note that several of the stocks do not appear to outperform SPY, which illustrates that databases do not always agree, and that cross-checks are needed before investment decisions are made.
Because of the conflict between the Relative Strength quantitative filter and the visual inspection of the charts, we would probably drop the quantitative Relative Strength filter next time around and visually inspect the 47 companies from the prior filter step. That might reveal other securities with attractive visual relative performance, creating a modified list.


Stocks named in the table image and charts are: PEP, MCD, KFT, LMT, KMB, FPL, K, CPB, CLX, BF.B, MKC, UG, and SPY. Except for the S&P 500 index, they are predominantly consumer staples stocks, with a couple of utilities.
We are predominantly out of equities at this time in the portfolios we manage, but find some of these stocks interesting for future consideration.
Holdings Disclosure: As of May 21, 2010, we have some exposure to PEP mentioned in this article in some, but not all, managed accounts. We do not have current positions at this time in any other securities discussed in this document in any managed account.
By Richard Shaw http://www.qvmgroup.com
Richard Shaw leads the QVM team as President of QVM Group. Richard has extensive investment industry experience including serving on the board of directors of two large investment management companies, including Aberdeen Asset Management (listed London Stock Exchange) and as a charter investor and director of Lending Tree ( download short professional profile ). He provides portfolio design and management services to individual and corporate clients. He also edits the QVM investment blog. His writings are generally republished by SeekingAlpha and Reuters and are linked to sites such as Kiplinger and Yahoo Finance and other sites. He is a 1970 graduate of Dartmouth College.
Copyright 2006-2010 by QVM Group LLC All rights reserved.
Disclaimer: The above is a matter of opinion and is not intended as investment advice. Information and analysis above are derived from sources and utilizing methods believed reliable, but we cannot accept responsibility for any trading losses you may incur as a result of this analysis. Do your own due diligence.
Richard Shaw Archive |
© 2005-2022 http://www.MarketOracle.co.uk - The Market Oracle is a FREE Daily Financial Markets Analysis & Forecasting online publication.


