Will Extreme Market Volatility Actually Stabilize the Markets?
Stock-Markets / Stock Markets 2010 May 24, 2010 - 05:13 AM GMTBy: Money_Morning
 Jon D. Markman writes: Stocks tumbled across the board last week like a pair of dice rumbling around a craps table, rocked by extreme volatility. Just when it looked like they were rolling up the unnerving loss of the critical 200-day average on Thursday, bulls' returned to the fray and pushed the major indexes just barely back into safe territory.
But is the market really safe? It's currently at the bottom of its multi-week range, so this is the time to get bullish again if you think the range will remain in force. The S&P 500 Index actually touched its February 2010 low on Friday before rebounding, which will give all the range-traders a green light.
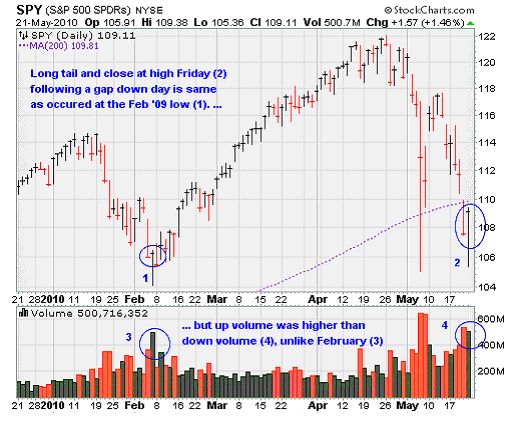
The long "tail" on Friday's daily bar as shown above -- a condition that occurs when an index plunges in the morning, then rebounds and ends up -- is considered one of the most positive signs in the technical trader's handbook. But the positive quality was blunted by the fact that the down volume on Thursday was larger than the up volume on Friday, which is a bad sign.
And to be sure there is plenty even for bulls to worry about: Disunity among European and U.S. financial leaders, tightening credit in Australia and China, new protests due in Greece, and a failed bond auction in Spain are just the highlights. Moreover the decline of business activity and stocks in Asia and Brazil have created a big headwind, as have widening efforts at financial regulatory reform in Washington and lawsuits against major Wall Street firms.
More directly weighing on stocks is the lack of support among investors for solid earnings news in the past week, and the pace of upward earnings revisions by analysts slowed. And finally, volatility has been crazy, as 15 of the past 19 sessions posted 100-plus point changes in the Dow Jones Industrials. That's very unusual. Compare that with the 40 sessions from mid-February to mid-April when only three days featured 100-point moves.
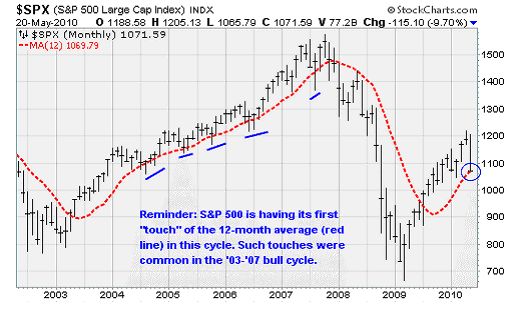
You can see the big-picture that at least gives bulls a hope in the chart above: The S&P 500 Index is testing its 12-month average for the first time since crossing it in the middle of last year. This was a common occurrence in the 2003-2007 rally, not a terminal event. It's usually just a pause that refreshes, even though it always seems like a crushing blow when it occurs. Note that in 2004, 2005 and 2006 the index actually fell well below the 12-month average mid-month before buyers pushed it back up.
I'm going to say something about the volatility which you may find crazy, but here goes anyway: The turmoil in the markets of late is ironically a sign of increasing stability, as sectors and regions that got way out of line on the upside have come down in value as they reach toward their medians.
The good news: Now that we've seen a period of extra-low volatility in March and April followed by a period of extra-high volatility in May, the next stretch is likely to feature more normal volatility.
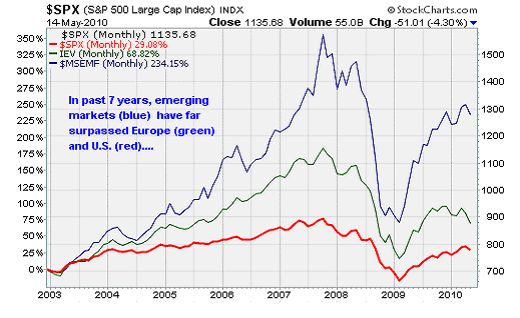
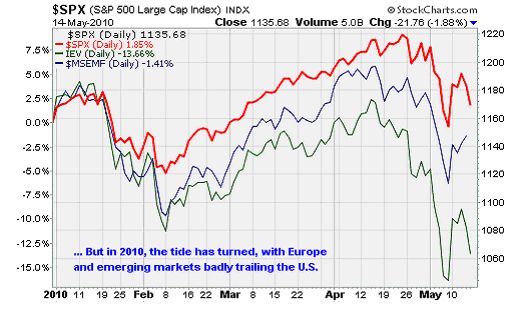
Now there is some more good news. U.S. economy and stocks showed great relative strength vs. the world. It's hard to know whether this is a sustainable trend. In some ways it runs counter to a seven-year move in the other direction.
As shown above, emerging markets are up 234% since the start of 2003, vs. +29% for the S&P 500. But in this year, the emerging markets and Europe have far underperformed the United States. In 2010, the S&P 500 is up 1%, vs -1.4% for the emerging market and -13.6% for Europe.
.Bottom line: The U.S. market remains in a primary uptrend, but it is being tested. Breadth data and historical relationships suggest that buyers ought to come back in a big way now, but their resolve in turn will be tested at the mid-May rally high, around 1,175. My expectation is that bears will regroup at that point and push the bulls back below current prices in June. In short, expect more fun and games.
QUICK TAKES
Now here are some thoughts on key matters that lie before investors, gathered and interpreted after my weekend readings of TIS Group, ISI Group, Cumberland, and other trusted institutional analysts.
-- Why did markets appear to reject the 750-billion euro rescue program so quickly last week? Geneva professor Charles Wyplosz writes that EU leaders made the error of over-selling their ''shock and awe'' package before establishing any political mechanism to mobilize the dough. ''The fund is an empty shell,'' he wrote at the European policy blog Vox EU. ''Worse still, crucial principles have been sacrificed for the sake of unconvincing announcements.'' Moreover Ambrose Evans-Prichard of the London Telegraph wrote that Brussels was unwise to talk of smashing the "wolf pack" speculators and defeat the ''worldwide organized attack'' on the eurozone without actually taking steps to do so. As Napoleon said, if you set out to take Vienna, take Vienna. Otherwise, your enemy will only mock you, observe your weakness and attack harder.
-- Six months ago, the consensus believed that global GDP had stalled. Now the consensus is that GDP is strengthening. So the question has become: how far out are stocks pricing in a recovery in earnings? In some cases, you might be surprised to learn that prices are already discounting earnings in 2012. If that becomes more widely true, then this entire economic cycle could be priced in by the end of this year.
-- The emerging markets became a crowded trade by the end of last year. The theory was that economies in China, South America and South Asia are growing much faster than economies in the West. This year the focus on overseas markets has changed directions dramatically. Is it a lasting change, or temporary? My expectation is that it's temporary, because a lot of data now suggests that many emerging countries' finances are in much better shape than their larger peers after years of forced reform by the IMF. The problem in EMs is more related to corruption than balance sheet strength.
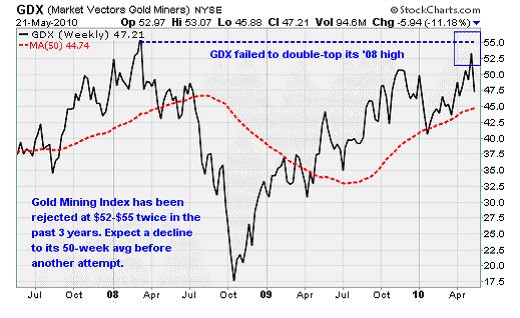
-- There are lot more portfolio managers reporting that they own gold now than in the past. But global analyst Larry Jeddeloh tells us that most managers he talks to only own 2% to 3% of their portfolios in precious metals. Many are also first-time owners of gold, and he says it won't take much more momentum to nudge them toward a higher weighting. Note that while physical gold is trading near an all-time high, the miners in the Market Vectors Gold Miners ETF Index (NYSE: GDX) just failed to hold their high of October last year or double-top the March 2008 high. I don't think this is the end for gold miners, so just expect a decline to around $45 before another rally attempt is begun.
-- Spain, Portugal and Italy are discussed as the potential next victims of credit attack in Europe, but most people probably don't realize that they are modestly healthier than Greece. Greece has been restating its GDP for years, after all, and has always been known as a profligate spender that's rife with corruption, tax evasion and debt defaults. Markets are right to be skeptical of its promises to impose austerity and correct budget imbalances, as street protests objected to every concession to Eurozone leaders. Already investors can witness runs on Greek banks and observe its BB+ debt treated as junk.
In contrast, Portugal is rated A- by Standard & Poor's, which is investment grade. Its austerity budget plan is considered credible and analysts believe it is on its way to cut its deficit to 4.6% of GDP by 2011 from 9.4% at present. Its people and unions have already accepted a 5% pay cuts for state-owned company managers and politicians, an increase in taxes and an increase in the VAT rate.
Other supposedly endangered countries in Eurozone are actually considered in even better shape. Italy is rated A+, Ireland and Spain AA, Belgium AA+ and the Netherlands, France, Germany, Austria and Finland AAA. Yet Ireland, Italy and Spain are always touted as basket cases. They may be in the future, but for now the ratings agencies consider them to be good credits.
-- Marc Chandler, head of currency strategy at Brown Brothers Harriman, said last week about the euro zone: "After less than a 12 year period, many observers are claiming the great European experiment is dead. Twelve years after thirteen colonies on the east coast of North America claimed independence from the most powerful empire at the time, they still did not have a constitution. They had a weak central government, without the power to tax and under the Articles of Confederation required unanimity in decision making. Yet to discount its future was a grave error.''
-- Now here's why it may not matter how strongly the debts of Spain, Italy, Portugal and Ireland are currently rated. Marco Pagano, economics prof at the University of Naples, wrote in Vox EU this weekend that even if a government is not highly indebted, investors might start questioning its willingness to raise taxes and might in the future seek a renegotiation of its bonds. Fear that this will happen can push its interest rates to a level so high that investors' prophecy will come true. So a contagion is more about fears and emotion than about facts -- but that doesn't make it less valid. . If there is confidence, a "good equilibrium" provides a balance of moderate interest rates and stable markets. When confidence disappears, the economy jumps to a "bad equilibrium" where a fiscal crisis occurs. Pagano argues that the contagion generated by Greek crisis has been exactly of this type. It has weakened investors' confidence in countries which would have otherwise been safe. Moreover, the burden of Greek bail-out itself is affecting negatively the fiscal position of Portugal, Spain, and Italy. This too may have contributed to weaken confidence in their ability to service the debt.
-- The Iceland volcanoes may have powerful long-term repercussions on trade. Many companies are already buying advanced video-conferencing systems to reduce their need to travel to northern Europe. Automakers in Germany are alarmed that they can't fly in parts from Asian plants, so they are said to be making plans to demand that their suppliers build parts close to home, in eastern Europe. That could be a problem for Asian economies focused on supplying Western multinationals when low costs are a priority. In cases like the present, costs may move down the priority list as the sureness of the supply chain moves up. If this encourages more companies to bring their logistics chain closer to home, the positive impact on U.S. and European industrial firms, and negative impact on Asian exporters, could be large. Also, even though jets can't fly through ash, ships can float through it and propeller-driven planes can fly through it. Perhaps we'll see a revival of the venerable DC-3.
-- P/E multiples for the S&P 500 for 2010 are 13x to 14x depending on your estimate of earnings, which now ranges from $80 to $85. If the Fed doesn't tighten rates this year, and inflation remains subdued, investors will likely be willing to pay 15x to 18x, as they have in the past in similar circumstances. So you can do the math yourself to come up with a target for the S&P 500. A 16x multiple on $85 yields a 1,360 target. A 15x multiple on $80 yields a 1,200 target. Both are higher than the current quote, and would be revised upward as the year rolls forward.
-- Barron's has reported a point of view expressed here many times: That corporate America has been piling up cash and low-cost corporate bonds, and will start to use it to increase spending, hiring, investing and acquiring. Two more mergers announced over the weekend show that M&A activity is increasing rapidly, and there has been an increase in special dividends in anticipation of higher taxes.
Tech companies like Apple Inc. (NASDAQ: AAPL), Cisco Systems Inc. (NASDAQ: CSCO) and Google Inc. (NASDAQ: GOOG) have the most cash, but many capital goods manufacturers and service providers also have high cash levels and free cash flows, including Goodyear Tire & Rubber Co. (NYSE: GT), International Paper Co. (NYSE: IP) and Ford Motor Co. (NYSE: F). Companies brimming with cash will use it to enhance their value. If the public won't buy their shares, company executives will do stock buybacks hand over fist and boost the value themselves. They did this heavily from 2003-2007, and they are doing it again. It's a big positive for equities that many people don't grasp.
Everybody loves a deal, and it's great to see the M&A machine is in full swing -- lifting values of four medium-sized companies on Monday last week alone. The biggie was Man Group PLC of England picking up asset manager GLG Partners Inc. (NYSE: GLG) for around four and a half bucks-- a 49.8% premium to Friday's price but still 70% off its 2007 level.
I cannot overstate enough how important these kinds of deals are to all asset prices. They keep short-sellers honest (no one wants to be short a stock with the potential to jump 50% in a day on a buyout offer), and generally provide an optimistic tone because they show that real buyers are willing to pay real money for real companies. The most important way that high cash flows keep share values higher occurs when companies buy back their own stock, which provides an automatic boost to earnings per share.
As long as there are deals, the bull cycle has a better-than-even chance at continuing. You'll know when this bull cycle is over when one of these deals fails to be completed due to lack of financing. That was the death whistle for the market in late 2007, and it will happen again in this cycle eventually.
Week in Review
Monday: The Empire State Manufacturing Index for May came in well under expectations, but did continue to indicate growth in activity among factories in the New York region. New orders remain strong while shipments actually increased over April's total. Separately, homebuilders continue to become more optimistic about the future as the Housing Market Index increased to the best level in more than two-and-a-half years. Lowe's Companies Inc. (NYSE: LOW) reported better than expected quarterly results, with earnings per share of 34 cents against the consensus estimate of 31 cents.
Tuesday: New housing starts increased more than expected in April as homebuilders responded to increased demand in the wake of the homebuyer tax credit. Starts increased 5.8% following a 5% gain in March. One possible worry is that permits dropped 11.5%. The Producer Price Index indicated a mixed picture for inflation. Energy and food prices remain high, putting the headline annual rate at 5.4%. But core inflation remains subdued at just 1%. Retailers Home Depot Inc. (NYSE: HD) and Wal-Mart Stores Inc. (NYSE: WMT) both reported better than expected results and issued positive guidance.
Wednesday: Obviously, business still lacks pricing power. At least, that's the story the Consumer Price Index tells us. The headline inflation rate came in at 2.2% -- less than the Producer Price Index, which means that producers are absorbing some of the rise in food and energy costs without passing them on to consumers. Less food and energy inflation remains low, with the core CPI at 1%. Farm equipment maker Deere & Co. (NYSE: DE) reported better than expected results and issued positive guidance.
Also, the Federal Reserve increased its GDP forecast for 2010 while lowering its inflation and unemployment expectations. The Fed now expects GDP in a range of 3.2% to 3.7% from 2.8% and 3.5% previously.
Thursday: Initial weekly jobless claims rose more than expected at 471,000 versus the 440,000 consensus estimate. Unless we get a big move lower for jobless claims soon, it will throw a wrench into optimistic forecasts of unemployment. Separately, the index of leading indicators was a bit weaker than expected on a decline in building permits and shortened delivery times. Dell Inc. (NASDAQ: DELL) reported better than expected earnings of 30 cents per share against the 27 cents analysts were expecting.
Friday: No major economic releases.
The Week Ahead
Monday: Existing home sales for April will reflect the last month of activity driven by the homebuyer tax credit.
Tuesday: An update on home prices from the Case-Shiller Home Price Index. Also, the latest consumer confidence numbers will be released.
Wednesday: Durable goods orders and new home sales.
Thursday: The government releases its second estimate of first quarter GDP growth. The advance estimate was 3.2% versus the 5.6% growth seen in the fourth quarter. Analysts expect the estimate of GDP growth to increase to 3.5%. Costco Wholesale Corp. (NASDAQ: COST) reports quarterly results.
Friday: Consumer sentiment, Chicago PMI, and personal income reports will be released. Retailers J. Crew Group Inc. (NYSE: JCG) and Guess? Inc. (NYSE: GES) report results.
[Editor's Note: Money Morning Contributing Writer Jon D. Markman has a unique view of both the world economy and the global financial markets. With uncertainty the watchword and volatility the norm in today's markets, low-risk/high-profit investments will be tougher than ever to find.
It will take a seasoned guide to uncover those opportunities.
Markman is that guide.
In the face of what's been the toughest market for investors since the Great Depression, it's time to sweep away the uncertainty and eradicate the worry. That's why investors subscribe to Markman's Strategic Advantage newsletter every week: He can see opportunity when other investors are blinded by worry.
Subscribe to Strategic Advantage and hire Markman to be your guide. For more information, please click here.]
Source : http://moneymorning.com/2010/05/24/extreme-volatility/
Money Morning/The Money Map Report
©2010 Monument Street Publishing. All Rights Reserved. Protected by copyright laws of the United States and international treaties. Any reproduction, copying, or redistribution (electronic or otherwise, including on the world wide web), of content from this website, in whole or in part, is strictly prohibited without the express written permission of Monument Street Publishing. 105 West Monument Street, Baltimore MD 21201, Email: customerservice@moneymorning.com
Disclaimer: Nothing published by Money Morning should be considered personalized investment advice. Although our employees may answer your general customer service questions, they are not licensed under securities laws to address your particular investment situation. No communication by our employees to you should be deemed as personalized investent advice. We expressly forbid our writers from having a financial interest in any security recommended to our readers. All of our employees and agents must wait 24 hours after on-line publication, or 72 hours after the mailing of printed-only publication prior to following an initial recommendation. Any investments recommended by Money Morning should be made only after consulting with your investment advisor and only after reviewing the prospectus or financial statements of the company.
Money Morning Archive |
© 2005-2022 http://www.MarketOracle.co.uk - The Market Oracle is a FREE Daily Financial Markets Analysis & Forecasting online publication.


