Hurricane Season Crude Oil and Natural Gas Profits
Commodities / Commodities Trading May 21, 2010 - 08:45 AM GMTBy: Sean_Brodrick
 The 2010 Atlantic hurricane season officially starts on June 1. But smart traders are already gearing up. The Gulf of Mexico is responsible for 13% of the U.S. natural gas production (and 30% of its domestic crude oil production). A strong hurricane — or two — hitting in the wrong place could knock some of that production offline. And just the possibility of that happening could put a bid into energy prices when and if the first hurricanes form off the coast of Africa.
Earlier this month, two offshore production platforms in the Gulf of Mexico were shut as a safety precaution against the spreading oil slick from the Deepwater Horizon oil spill. But that’s not the real threat.
The real threat is hurricane season, which can force the shutting down (or “shut in”) of gas and oil rigs all across energy alley in the Gulf of Mexico. And this year’s hurricane season has the potential to be a doozy. Let me give you three reasons why …
1) Weather forecasters are already calling for a strong season. The highly respected hurricane forecasting team at Colorado State predicts 15 named storms this year. AccuWeather expects 16 to 18 named storms. And private forecasting company WSI expects seven to nine storms, but that is up from its earlier forecast. The long-term (1950-2000) average is 9.6 named storms, and the short-term (2000-2009) average is 15 named storms.
The official U.S. government forecast issued by the Climate Prediction Center will be issued May 27th. If that falls into line with other forecasts for a busy season, then oil and natural gas prices should both move higher.
And that’s not the only worry …
2) A La Niña may be brewing. According to the Climate Prediction Center, a La Niña is showing signs of developing. This is an ocean-atmospheric phenomenon that could intensify the upcoming Atlantic hurricane season and influence the 2010-11 winter.
The last La Niña was a moderate one, which developed in mid-2007. You may remember that 2007 was an active Atlantic hurricane season that produced 17 tropical cyclones, 15 tropical storms, 6 hurricanes, and 2 major hurricanes. It was one of only four hurricane seasons on record for the Atlantic with more than one Category 5 storm.
Right now, there is an El Niño in place. El Niño, the opposite of La Niña, usually retards the development of hurricanes — but El Niño is weakening. And that is not good news, according to the Climate Prediction Center.
Remember, this is just a forecast, and weather forecasts don’t always come true. Unfortunately, there is another ingredient for strong hurricanes.
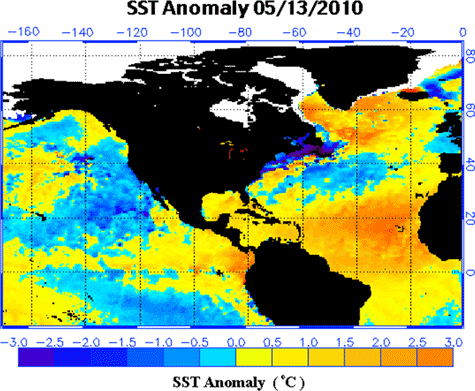
3) The oceans are steaming hot. According to an analysis by Dr. Jeff Masters at the Weather Underground’s Wunderblog, Sea Surface Temperatures (SSTs) in the Atlantic’s Main Development Region for hurricanes had their warmest April on record.
The area of the Atlantic between 10°N and 20°N, between the coast of Africa and Central America (20°W — 80°W), is called the Main Development Region (MDR) because virtually all African waves originate in this region. These African waves account for 85% of all Atlantic major hurricanes and 60% of all named storms.
This graphic shows how warm the waters are. The orange areas are abnormally warm. And the MDR is hot-hot-hot!

Dr. Masters writes:
The three past seasons with record warm April SST anomalies all had abnormally high numbers of intense hurricanes. Past hurricane seasons that had high March SST anomalies include 1969 (0.90°C anomaly), 2005 (1.19°C anomaly), and 1958 (0.97°C anomaly). These three years had 5, 7, and 5 intense hurricanes, respectively. Just two intense hurricanes occur in an average year. The total averaged activity for the three seasons was 15 named storms, 11 hurricanes, and 6 intense hurricanes (an average hurricane season has 10, 6, and 2.) Both 1958 and 2005 saw neutral El Niño conditions, while 1969 had a weak El Niño.
And as I told you earlier, we probably won’t have an El Niño this year. If we’re unlucky, La Niña will rear her ugly head.
The market will probably start pricing this in, for both oil and natural gas.
Crude Oil: Bubble and Trouble
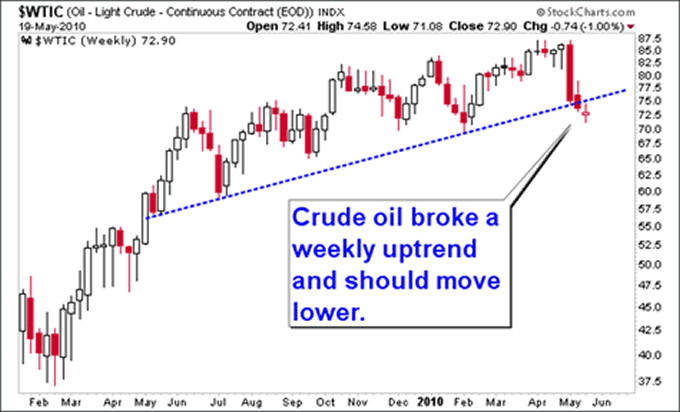
Crude oil is under pressure. Looking at a chart, you can see that crude broke a months-long weekly uptrend. Now, $67 or even $65 become possible targets.

Crude is under pressure because of the debt crisis rocking Europe. That crisis not only weighs on European oil consumption, it also weighs on China’s growth, because China is a huge exporter to Europe. All these economic worries are sending the oil speculators rushing for the exits.
There is also plenty of crude oil around. The Energy Information Administration (EIA) reported on Wednesday that crude oil inventories in the U.S. added another 200,000 barrels last week, pushing inventories 6.6 million barrels above their seasonal average. The inventories at the oil hub in Cushing, Oklahoma hit their highest level ever since records started being kept in 2004. And this is happening even though refinery throughput (demand for crude oil) in the U.S. is averaging around 5% above the seasonal norm.
Also, lower oil prices are self-correcting. Every one-cent decrease in the price of gasoline accounts for $1.3 billion in increased funds available for consumer spending. So, falling crude prices will boost economic activity. And eventually, that will lead to higher prices for crude.
The fundamentals of crude could change in a heartbeat if and when the first tropical depression forms in the Atlantic.
Natural Gas Could Also Head Higher
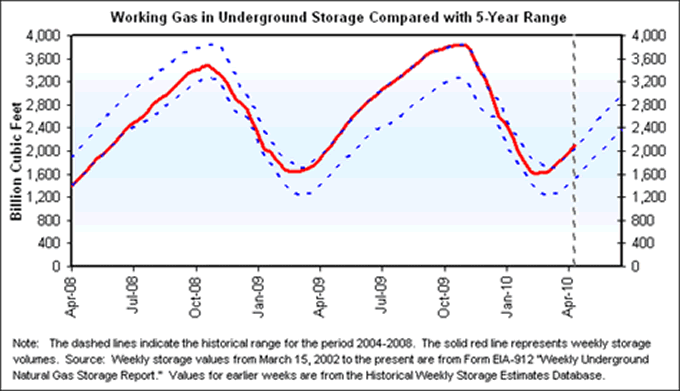
To be sure, there is no shortage of natural gas at this time. Working gas in storage totaled 2,089 billion cubic feet as of Friday, May 7, according to EIA’s Weekly Natural Gas Storage Report. This brings the current level of supplies in underground storage to 18.4% above the 5-year average.

So I’m not expecting a shortage of natural gas. I’m expecting traders and investors to worry that a busy hurricane season will impact natural gas production and therefore send prices higher. The same thing could happen with crude oil.
How You Can Play This Move
You could play a potential hurricane-fueled move in energy prices with exchange-traded funds. Here is an idea …
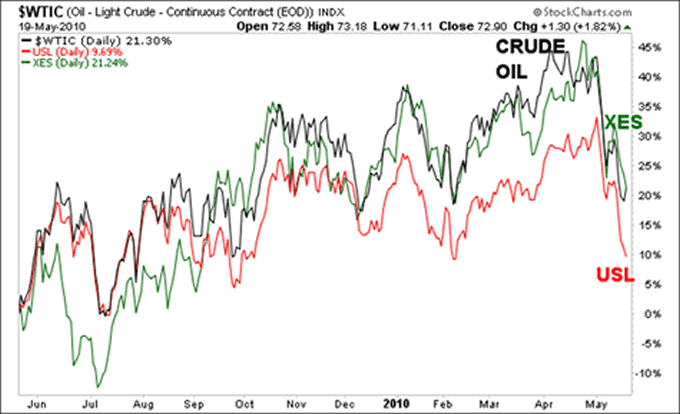
The United States 12-Month Oil Fund (USL) aims to track the price of oil. Like other oil ETFs, it does an imperfect job. The USL has clocked a 10% gain in the last year, which is half the gain made by crude oil at the same time. A better bet might be the SPDR S&P Oil & Gas Equipment & Services ETF (XES), which has tracked oil more closely. Take a look at this chart and you’ll see what I mean …

As for natural gas, you can track it with the United States Natural Gas Fund (UNG) or the First Trust ISE Revere Natural Gas ETF (FCG), which holds a basket of natural gas drillers and producers.
But be careful. Energy prices could spike quickly, then be gone with the wind as the first hurricane rounds the Florida peninsula into the Gulf.
Yours for trading profits,
Sean
P.S. You can check out what I write ever day on my blog at http://blogs.uncommonwisdomdaily.com/red-hot-energy-and-gold/.
This investment news is brought to you by Uncommon Wisdom. Uncommon Wisdom is a free daily investment newsletter from Weiss Research analysts offering the latest investing news and financial insights for the stock market, precious metals, natural resources, Asian and South American markets. From time to time, the authors of Uncommon Wisdom also cover other topics they feel can contribute to making you healthy, wealthy and wise. To view archives or subscribe, visit http://www.uncommonwisdomdaily.com.
© 2005-2022 http://www.MarketOracle.co.uk - The Market Oracle is a FREE Daily Financial Markets Analysis & Forecasting online publication.


