


Gold New All Time High, Bit the Uneasy Feeling is Still There
Commodities / Gold and Silver 2010 May 16, 2010 - 09:26 PM GMTBy: Merv_Burak

 A new all time high for gold but the uneasy feeling is still there. The move was on lower strength than the previous move in Nov. Is gold just running out of steam?
GOLD: LONG TERM - So, we’ve made it into new high ground (just barely so) with gold. Is this the start of a new move towards those higher highs everyone is looking for? Just to recollect your memory, a few weeks back my projections for gold were to the $1230 level followed by a move to $1470 and then to the projection almost everyone is making, the $1600 level. All this from the long term P&F chart.
What else does the P&F chart tell us? Well the one projection I have not mentioned for a long time was the one using a longer term P&F chart, a $25 unit, 2 unit reversal chart. That projection took us all the way to the $2575 mark but that is yet so far away it is no use getting too far ahead of ourselves. Stay focused on that $1600 level. It will not come quickly or straight up but the price will go up and down while progressively heading higher. But back to the present.
Despite the mild set-back on Thursday and Friday the long term indicators remain firmly in the positive side. Gold price remains above its positive sloping moving average line and the momentum indicator is in its positive zone above its positive trigger line. The volume indicator entered new high ground in late April and remains there. For now the long term rating remains BULLISH.
INTERMEDIATE TERM
There is not much one can say as far as the intermediate term is concerned. The price of gold remains above its positive moving average line and the momentum indicator remains in its positive zone above a positive trigger line. Not mentioned in the long term analysis but there and here the momentum indicator is considerably below the level it reached during its previous march into new high ground during late Nov. This gives us a negative divergence pattern that is a warning of future potential problems. It puts one on guard and not to get too enthused about the move. The volume indicator continues to move above its positive trigger line for a positive reading. All in all the intermediate term rating remains BULLISH, at this time.
SHORT TERM
As often mentioned, trends should first be noted in the short term charts and indicators. When we do have these short term indications of reversals either in progress or verified one should not forget that the indicators ARE only for the short term and one should not apply longer term implications to them without getting confirmation from the longer term indicators. I have seen too often analysts whose supposed investment time frame is intermediate or long term but use short term charts and indicators for their signals.
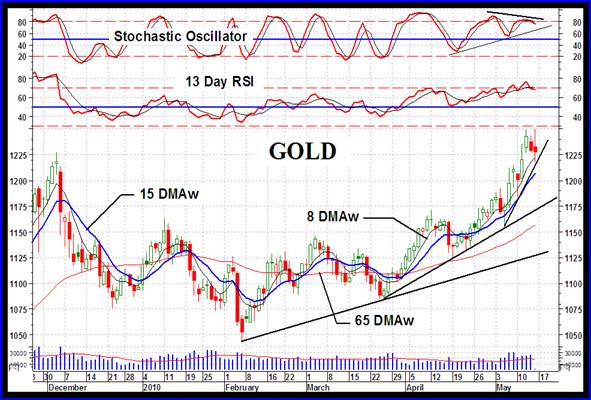
This week the short term chart has a couple of interesting patterns or indicators that are not often mentioned as they do not often occur. First, the Stochastic Oscillator, which is a very short term indicator, is giving us a well defined negative divergence versus the price trend. It has now once again dropped below its overbought line and below its negative trigger line. Confirmation of a trend turn would be further verified when the SO drops below the short term up trend line shown. The SO reversing is not, by itself, always a confirmation of price reversal but most of the time it is.
The second pattern is that expanding set of three trend lines. Because of the time period for their development they may be looked at as short or intermediate term patterns. These are one of my Merv’s FAN PRINCIPLE trend lines. These I refer to as BEARISH ACCELERATING FAN lines. They are bearish because the breaking of that third fan trend line is a confirmation, in this pattern, of an end of the bull trend and the beginning of a bear trend. I say “in this pattern” because in most of my FAN PRINCIPLE patterns the breaking of the third trend line is only a reversal signal while the breaking of the second trend line, following the third trend line break, is the confirmation. This “acceleration” pattern shown is often referred to as a “blow-off” move which cannot last long because of its sharp and strong move. As you can see, each succeeding fan trend line is an acceleration of the trend thereby the term accelerating fans. The breaking of this third fan trend line should occur on a down day but could just as easily occur on a lateral day trend. A lateral move which breaks through the up trend line is not as strong a signal until a reasonable down day comes along to verify the move. Also with this type of strong bullish move, watch for a close below the low of the previous three days. That could also be a signal of a reversal in progress.
So, where are we using my normal short term indicators? The price remains above its positive sloping moving average line. The momentum indicator is well inside its positive zone but has now dropped below its negative trigger line. More ominous, the momentum was in its overbought zone and is now below its overbought line for a warning (only a warning) of a weakening of trend. The daily volume action is still quite positive and remains above its average volume for the past 15 days. All in all, the short term is still BULLISH but weakening. The very short term moving average line remains above the short term line for a continuing confirmation of this rating.
As for the immediate direction of least resistance, with the world situation as it is it’s murder trying to guess a few days ahead what is going to happen on the world front that fight spoil any technical considerations from the immediate term. However, with both the short term momentum indicator and the Stochastic Oscillator both implying a reversal of trend potentially just about upon us I’ll go with the down side as the direction. This may take a day or two but by Tuesday we should know if that prognosis is anywhere near correct.
SILVER
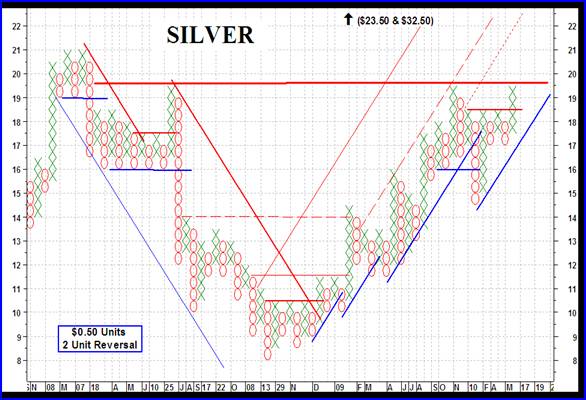
I know I showed the P&F chart of silver last week but I thought I’d show it again, only with a longer historical data period. The bullish break-out this past week gives us a projection to $23.00 which is very close to the $23.50 projection from the $12.00 break some time back. There is also a $32.50 projection from the $14.50 break. Of note is that resistance at the $19.50 level. Should that resistance be broken, and especially should silver move into new highs, then we could have a P&F projection well into the $60 range, but let’s not get too far ahead of ourselves. Stick to the lower projections first and then go with the trend, wherever it takes you.
One of the main benefits of Point & Figure charts is that they filter out data that may be just noise, i.e. shorter term moves. They also filter out moves that are not of a major amount based upon their unit price criteria. This past week, although silver moved into new rally highs it was only by a few cents and not enough to plot an extra X on the chart to show a P&F new high. I would follow the P&F non verification of this new high until the price finally hits the $20.00 for that next X plot and a new recovery high. Getting overly enthused just because the price went a few pennies, well $0.35, above its previous high may be wistful dreaming until better confirmed.
Last week I went through the technical indicators for the three time periods. Nothing has changed from last week so the rating for all three time periods remains BULLISH.
PRECIOUS METAL STOCKS
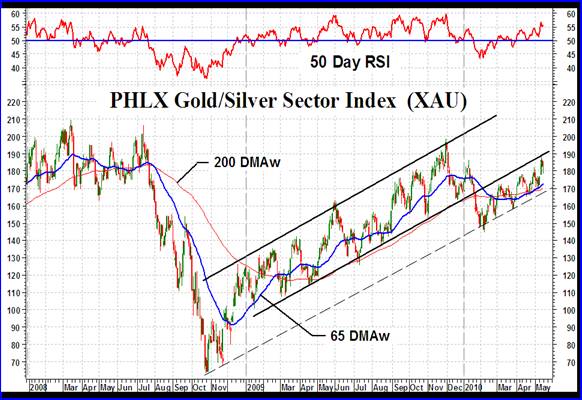
For obvious reasons I usually show one of my Merv’s Indices here. Today I thought I’d show the most popular major Index, the PHLX Gold/Silver Sector Index, commonly just referred to as the XAU. The XAU has been in a rally mode since bottoming out in early Feb. However, its move still leaves a lot to be desired. It has not yet exceeded its previous Nov/Dec high least of all its previous bull market high two years back. Of the 8 Merv’s Indices only the Qual-Silver Index has not made a new recovery high while the Qual-Silver and Gamb-Gold Indices are still below their highs of two years back. All other Indices are well into new all time highs, as is the overall Composite Index of Precious Metal Indices.
One should be very cautious when looking at the performance of the XAU (or the other major Indices) and applying that performance to the gold and silver stocks in general. For that matter, one should not even apply this Index to the majority of “quality” stocks. Merv’s Qual-Gold Index, an Index of the top 30 gold and silver stocks (by market value) traded on the North American markets is about 12% above its previous bull market high of two years back.
Although the Merv’s Indices are well into new high territory the intermediate and long term momentum of the trend is showing negative divergence versus the Index trend. This is a warning that the future holds danger and one should be on guard for a possible reversal of trend ahead. It’s just a warning at this time and the market could go a lot higher but a warning is a warning.
Merv’s Precious Metals Indices Table
Well, I think I’ll call it a day.
By Merv Burak, CMT
Hudson Aero/Systems Inc.
Technical Information Group
for Merv's Precious Metals Central
For DAILY Uranium stock commentary and WEEKLY Uranium market update check out my new Technically Uranium with Merv blog at http://techuranium.blogspot.com .
During the day Merv practices his engineering profession as a Consulting Aerospace Engineer. Once the sun goes down and night descends upon the earth Merv dons his other hat as a Chartered Market Technician ( CMT ) and tries to decipher what's going on in the securities markets. As an underground surveyor in the gold mines of Canada 's Northwest Territories in his youth, Merv has a soft spot for the gold industry and has developed several Gold Indices reflecting different aspects of the industry. As a basically lazy individual Merv's driving focus is to KEEP IT SIMPLE .
To find out more about Merv's various Gold Indices and component stocks, please visit http://preciousmetalscentral.com . There you will find samples of the Indices and their component stocks plus other publications of interest to gold investors.
Before you invest, Always check your market timing with a Qualified Professional Market Technician
Merv Burak Archive |
© 2005-2022 http://www.MarketOracle.co.uk - The Market Oracle is a FREE Daily Financial Markets Analysis & Forecasting online publication.