Stocks Bull Market Hits Eurozone Debt Crisis Brick Wall, Forecast Into July 2010
Stock-Markets / Stock Markets 2010 May 16, 2010 - 09:01 PM GMTBy: Nadeem_Walayat
 Are the markets manipulated ? Are they ?
You have been repeatedly told by those that clearly don't immerse themselves in trading on a regular basis that they are not manipulated instead the movements are a function of some ordered theory that implies certainty of outcome when all one can do in reality is to conclude towards a probability of outcome that are usually little better than 60/40, well on the 6th everyone got the answer that they should imprint into their memories that the markets REALLY ARE manipulated. If your going to learn one lesson from 2010 then let that be the lesson learned. Contemplate on it, let it sink in, let it skew how you interpret price action and maybe you too can join in on future market manipulations!
Stock market volatility soars, the Flash Bounce follows the Flash Crash, the manipulated markets are not giving investors and traders time to react as the dark pools of capital continue to rake in huge profits by circumventing official exchanges such as the NYSE which if my memory is correct ALREADY HAS CIRCUIT BREAKERS that should have STOPPED the CRASH in its track so why didn't it ?
Obviously, because far more trading of shares and their derivatives is taking place between the Dark Pools of capital OFF of the exchanges, which is ideal for a manipulators paradise. It will be interesting to see how high this months Goldman Sachs profits will leap after the 1st quarter having generated $25 million of profit EVERY DAY!
So, yes the markets are manipulated, though that is nothing new as all human activity involves manipulation of our environment to one degree or another where any mechanisms put into place to limit human manipulation are soon circumvented, we are a species of manipulators, we live in highly manipulated cities that are completely distant from the environment of the natural world, so don't waste time going look for reasons of why the flash crash happened or crying about it, instead look for the finger prints for future market manipulation's that show their hand ONLY in the price charts! Not anywhere else! (more on the flash crash here - 09 May 2010 - Don't Blink Or You Will Miss The Stock Market Crash!)
Therefore this third bi-monthly in-depth analysis of the stock market for 2010, posted on Sunday 16th May (ensure you are subscribed to my ALWAYS FREE newsletter to get these and my weekly updates in your email in box) will again attempt to do the near 'impossible' by concluding towards a forecast trend projection for the stock market for the next 2 months, a tough task when considering today's volatile flash crashing market environment, where it has become even difficult to project what the market will do in the next hour let alone 2 months forward!
UK Election Politicking is Over
The electorate has had their vote and settled upon a ConDem coalition government that will probably go up in smoke within 12 months under the weight of public anger at the cuts and tax rises that are about to hit the populous (not forgetting soaring inflation!).
Now it is time for the markets to vote, and they have sent sterling and UK stocks sharply lower. Though this should work to the advantage of UK investors in the mega caps as a weak sterling means the UK's big export based corporations should see their share prices outperform. The only question remains is to what extent will the ConDem government seek to bleed the corporate's much as the Australian Government's tax on resources is bleeding the mega miners.
British Pound Following the Euro Lower
Sterling at £/$1.45 remains firmly on track to achieve its forecast sub £/$1.40 low (26 Dec 2009 - British Pound GBP Forecast 2010 Targets Drop to Below £/$1.40) now probably within the next 2 weeks, the specific support target lies at £/$ 1.37. I will seek to update sterling and as part of my in-depth update for the U.S. Dollar bull market later this month.
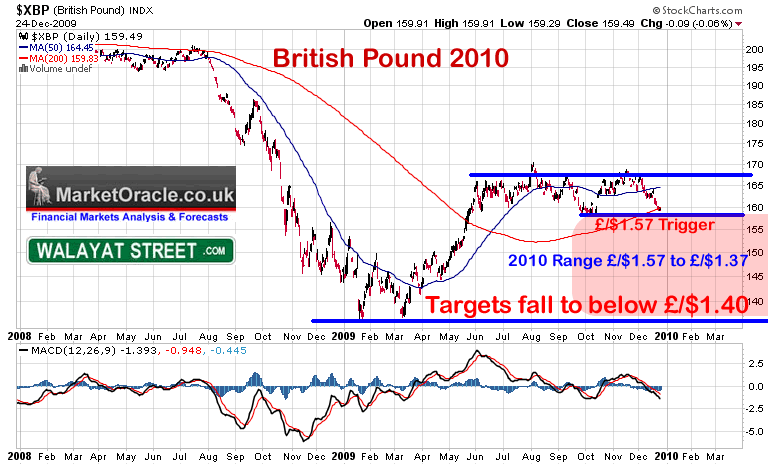
1. That sterling is targeting immediate support at £/$1.57 which implies it may temporarily bounce from there back through £/$1.60 before the eventual break.
2. That a break below £/$1.57 would target a trend to below £/$1.40. On a longer term view, the chart is indicative of trading range between £/$1.57 and £/$1.37, on anticipation of the eventual break of £/$1.57. On average this implies a 10% sterling deprecation against the trend of the preceding 6 months or so.
German Euro Gravy Train is Over
Germany has benefited hugely at the expense of other Eurozone countries over the past decade as it's highly competitive industry had a captured euro-zone market to export to that the other countries could not devalue against. German exports were further boosted by a weak euro that enabled global exports to be maintained, however all of these small eurozone countries are now risk imploding and are lining up for a German and French handouts, the only sustainable answer to which is for the Eurozone to split into two as I speculated upon early in the week - (11 May 2010 - E.U. $1 Trillion Bailout, Detonates Nuclear Option of Printing Money to Monetize PIGS Debt).
Financing albeit shrinking annual PIGS deficits over the next few years will still mean that ALL of these countries debt burdens will be HIGHER in 3 years time, i.e. Greece's debt burden is expected to rise from 120% of GDP to as high as 150% of GDP. How is that a solution for the debt crisis? How will that prevent eventual debt default ? Answer - It won't!
The ONLY solution is for the Eurozone economies to GET their economic houses in order which means cut the deficits and total debt as a % of GDP which can only be achieved through economic growth which means public sector spending cuts and reform of economies to generate economic growth that means LESS E.U. and national regulation as touched up on in the article Solving Britain's Economic Crisis Through Micro Business Capital Investments and Credit (31st Mar 2010). However when a country has a debt burden of 120%+ of GDP at interest rates of 5% or higher the inevitable result is still debt default.
EURO II ?
This, first of a series of money printing debt monetization bailouts puts the Euro firmly on a trend towards high inflation as are all fiat currencies, i.e. the fundamentals of the Euro block composed of many small weak economies that cannot devalue internally against highly competitive strong economies will still remain. The only possible solution is for a Euro II, i.e. split the Euro into two currency blocks one for the weak that suffer higher inflation and interest rates and the more competitive countries as part of the Euro II block (could just be Germany on its own?) which would act as a safety valve in times of economic crisis that demands internal currency devaluations.
The Euro Bailout is to pile more debt on top of existing debt which amounts to just being temporary sticking plaster that will eventually give way to the inevitable. At the end of the day countries such as Greece, Portugal and Spain and maybe several others will default on their debts, they have no choice, NONE ! With debt at 150% of GDP the interest payments cannot be serviced even at artificially low interest rates of 4%-5% let alone any repayments entertained. which means the bailout is effectively dumping Greek and other PIGS debt onto German and French tax payers. The strategy appears to be for Germany and France to buy some time to erect a firewall between themselves, their banks and future euro-zone debt defaulters.
A big step in creating such a firewall would be for the Euro to split into two with Germany and France and maybe a few others in Euro II, which would allow all the other bankrupting euro-zone states to competitively devalue, print money and set more appropriate interest rates as they attempt to INFLATE their economies and off course default in a more orderly manner with less fallout to the core Eurozone members.
In the meantime Greeks continue to riot, perhaps given their long history and having given genesis to many of the academic institutions that are now trying to force their economic theory of what should be done, Greeks are fully aware that the likes of the IMF and E.U. are totally clueless when it comes to doing the right thing, which is evident in the fact that countries such as the United States, Germany, France and Britain have done the EXACT opposite to that which the IMF says they should have done!
Dangerous Democracy
Another factor that seems to have escaped the mainstream press is that hated governments with hated austerity policies tend to get thrown out of power and replaced with more financially inept governments that offer to take the pain away. Which suggests that if there isn't a Euro II sooner rather than later then the Greeks and other PIGS may vote in governments that force the European Union's hand by unilaterally exiting the Euro and defaulting on their debts as there exists a greater preference to swim in the warm inflationary waters of the Meditarian than freeze to death in an icy deflationary imploding economy as Germany requires them to do as a consequence of the Eurozone bailout.
The bottom line is that the ECB has chosen to sacrifice the Euro by joining the rest of the central bankers money printing club, the ultimate consequences of which is inflationary and not deflationary as illustrated by the 100 page Inflation Mega-Trend Ebook (FREE Download NOW)
Implications for Stock Markets - The markets have voted with a big thumbs down to the bailout which is evidenced by the Euro closing at just 123.30 instead of 130 where it had rallied to on the announcement, it clearly has a lot further lower to go. Bailouts sap life out of the private sector that are the engines for economic growth as the cost of the bailouts are dumped onto tax payers of the more competitive countries, this will undoubtedly eventually impact on the corporations of the eurozone which is discounted in the present, against this is balanced the depreciation in the euro therefore benefits those corporations that export to outside the euro-zone. A eurozone in slow motion collapse is not good for bullish stock market sentiment but there are stocks and sectors that will benefit from their dollar earnings boost.
Stock Market Trend Against Forecast and Expectations
A quick recap of the two in depth analysis of the year to date and the most recent short-term update:
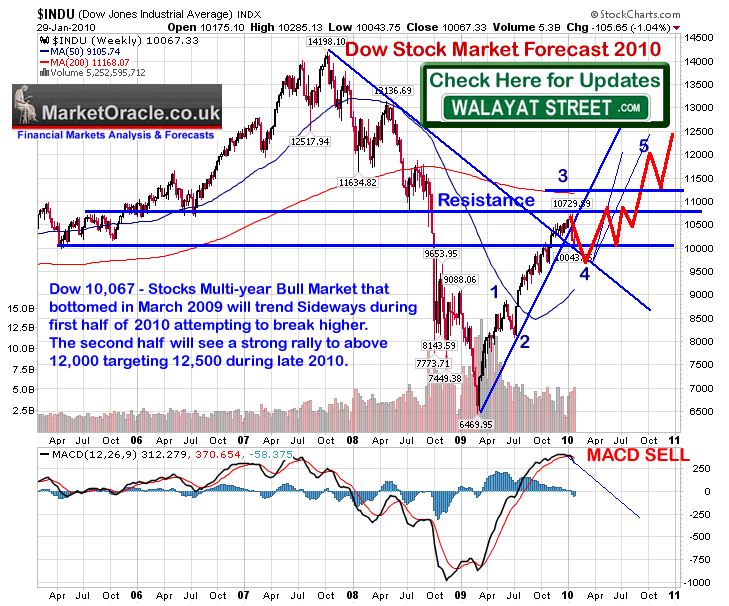
02 Feb 2010 - Stocks Stealth Bull Market Trend Forecast For 2010 - The Inflation Mega-Trend Ebook Page 82 (DIRECT Download)
Dow 10,067 - Stocks Multi-year Bull Market that bottomed in March 2009 will trend Sideways during first half of 2010 attempting to break higher. The second half will see a strong rally to above 12,000 targeting 12,500 during late 2010.
23 Mar 2010 - Stocks Stealth Bull Market Trend Forecast Into May 2010
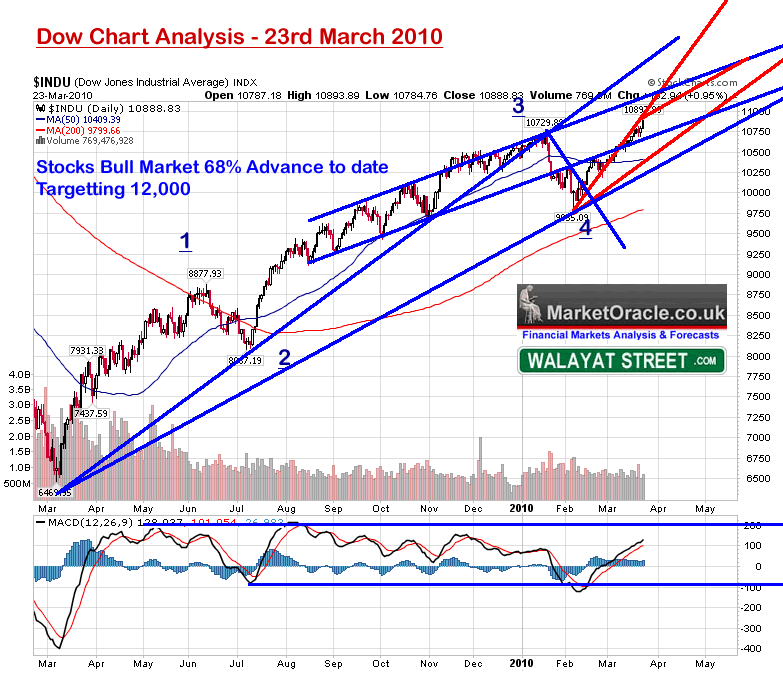
Dow (DJIA) March to May Stock Market Trend Forecast Conclusion - Therefore my specific conclusion is for a continuation of the uptrend into early to mid May, achieving the 12,000 target during this time period, also allowing for a correction during April.
Weekly Newsletter Update - 02 May 2010 - Greece Debt Crisis Storm Cripples Stock Market Rally Resulting Stock Price Churn
The stock market ended the week weak at 11,008, barely clinging on to its uptrend as of February 2010. The SELL trigger is less than 40 points away at 10,970. The trend is choppy and volatile that looks likely to continue.
My trend expectations by the 23rd of March 2009 had converged towards a strong bull run into early to Mid May 2010 to target 12,000 before a significant correction took place i.e. an acceleration of the trend off of the early Feb low that had lifted the Dow to 10,830 after it cleared the 50% axis at 10,333. The trend continued to a high of 11,258 by early April before stalling.
The market was hit by a series of debt crisis shock waves out of Europe which had the effect of eroding the time left for the rally to be achieved all the way into early May 2009 when my quick update (02 May 2010 - Greece Debt Crisis Storm Cripples Stock Market Rally Resulting Stock Price Churn) concluded that the market had just about run out of time and was hanging on to the uptrend by its finger nails within a few points of the SELL TRIGGER at 10,970, the rally to that point had not triggered any of the sell triggers mentioned during the bull run from late February 2010 to the 2nd of May.
The sell signal was triggered on 4th May with the break below 10,970, followed by the Second Sell Trigger on the 5th of May on break below 10,830 which targeted 10,750 and then 10,550 and then along came Mr Flash Crash on Thursday the 6th which I covered in last weeks update (09 May 2010 - Don't Blink Or You Will Miss The Stock Market Crash!), which placed the Dow in a trading range of 10,300 to 10,600 pending a short-term breakout, that resulted in a recovery high to 10,920, with last Fridays close leaving the Dow at 10,620.
The Dow is clearly showing relative weakness against trend expectations, which reinforces expectations of the Dow entering into a trading range rather then any serious attempt at breaking higher in the immediate future.
Market Psychology - The Flash Crash sent shockwave's through the market that will last infinitely longer than its 30 minute duration. Clearly the bulls were shocked that the value of their portfolios can out of the blue go up in smoke within a matter of minutes. The bears who had been betting and losing against the stocks bull market as a consequence of their Bear market rally mantra who's end was always imminent were nearly equally as shocked, in that after all the expectations and losses to date when the sell off actually materialised they weren't given any time to act on it to monetize on the drop! as it came and went within a blink of an eye, which I have to say I find pretty amusing :)
As mentioned earlier, bullish sentiment is also further eroded as a consequence of the Eurozone panic where investors are now having to contemplate the unthinkable i.e. a break-up of the Euro, which whilst it may be good for the long-term, is not so good for stock trends for the balance of 2010.
As things stand, market sentiment wise the upper hand is clearly with the bears who despite being wary of being wrong on calling the end of the bull market or bear market rally again, will clearly grow louder in their assertion that yes this time it really is it especially as the Dow revisits the Flash Crash low area.
Implications for stock trend - It implies that the bulls are less eager to buy and the bears are more eager to short. Which does not support an imminent run to new stock market highs, rather an assault on recent flash crash low as being highly probable.
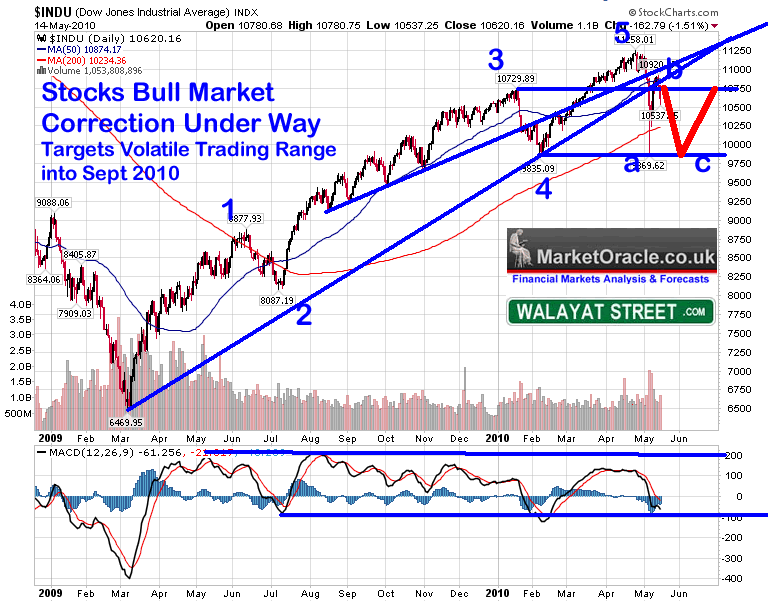
ELLIOTT WAVE THEORY - The EWT pattern has concluded towards a 5th wave peak by early to Mid May as illustrated by the March 23rd 2010 Chart above. Which concludes in an EWT pattern that will seek to correct the whole bull market trend off of the March 2009 low i.e. the most significant correction to date. The normal EWT expectation is for an ABC pattern for a lower C low. Which on face value suggests a break of the 9,870 Flash Crash low, to complete the ABC pattern in advance of the resumption of the bull market trend higher.
TIME ANALYSIS - The current correction will seek to correct the preceding 14 month bull market. Previous corrections within the bull market corrected the preceding trend by approx 1/3rd i.e. the Jan to Feb 2010 and June to July 2009 corrections. This therefore suggest that the current correction could last over 4 months, taking the trend into Late September / Early October, which implies a prolonged period of stock price weakness.
Bear Market and the 1930's Stock Price Chart Pattern - Every correction brings out these 1930 charts, is it this time ? After all it was not in January 2010 nor October 2009 before then nor August 2009 before. As ever the starting and end points are always moved to fit the price action. At the end of the day fitting past price charts onto the present ONLY works in hindsight and are totally worthless when it comes actually trying to determine and monetize on trends so plays no part in this analysis.
TREND ANALYSIS - The Dow started running out of steam at 11,200 as it entered the correction time window. The trend following that peak has been violently to the downside. This has made the trend extremely volatile which implies that one should continue to expect very large swings from day to day, as the Dow attempts to put in a bottom which at this point implies at the crash low of 9,870. The trend higher to 10,920 whilst strong, only sets the market up for a series of retests of the low.
INTERMARKETS - Whilst the Dow has marched to new highs for the bull market, China's stock market became stuck in August 2009 and has since moved in a large sideways trading range for the past year between 3,400 and 2,500. The last close at 2696 puts the market near the low which is a sign of relative weakness and does not bode well for other major stock markets to push to new highs whilst China remains weak with a lot of resistance to overcome. Furthermore a break below 2,500 would deteriorate the picture still further, similar weak patterns are exhibiting in other asian markets. This therefore implies a trading range expectation for the Dow for probably longer than the next 2 months.
MARKET INTEREST RATES - The interbank LIBOR market is again showing signs of freezing up as investors dump Eurozone sovereign bonds for safer U.S. Bonds thus driving U.S. yields lower and currencies elsewhere lower. The banks are becoming wary of lending money to one another fearing the level of exposure amongst banks to the EURO!, this is just as occurred with subprime mortgage backed securities but on a much larger scale. This is the hidden story behind the Euro crisis as a Euro triggered interbank market freeze would be far worse than that which followed Lehman's, which really could trigger a NEW BEAR MARKET. So it will be something that will eventually make it into the mainstream press if the interbank market does freeze again, its something no central bank including the U.S. Fed wants to happen.
This is going to directly feed into high stock market volatility that points to a trend towards the recent lows for stocks i.e. 9,870, probably sooner rather than later.
SUPPORT / RESISTANCE - Volatility has resulted in a wider range of support and resistance levels to keep focused on than has been the case for many months. Resistance lies at 10,920, 11,200 and then 11,260. Support is at 9800-9850. The wide range suggests that the Dow can be expected to continue to trade to both extremes of the immediate range of 10,920 and 9850 over the coming weeks. With the trend in the immediate future targeting the lower end of the range.
MOVING AVERAGES - The flash crash saw the Dow break the 200 day moving average, something that it has not done in nearly a year of the bull run. Furthermore the reactive bounce to 10,920 was more or less contained by the 50 day average. In the immediate future the 50 day acts as resistance and the 200 day acts as support. However I expect the 200 day to again easily give way and subsequently act as resistance which the Dow will need to overcome as it attempts to put in a bottom over the coming weeks.
PRICE TARGETS - Upside price targets resolve towards 11,260 and 11,900 to 12,000. Downside price targets resolve towards 9,800 to 9,850 and then 9,450.
MACD - The MACD is expected to hug the lower end of its range at -100 for the duration of the correction. Most recent activity suggests that Dow may be supported within the next few days for a weak trend higher over the coming weeks as MACD works out its oversold state in advance of another assault on the lows.
VOLATILITY - Market volatility as measured by the VIX spiked on Flash Crash day to 42. Current VIX at 31.24 remains elevated far beyond the sub 20 range of recent months, which is not supportive of an imminent stocks bull run. Usually a VIX of above 30 is supportive of downtrends, which implies immediate term stock market weakness, suggesting that the recent lows of 9872 / 10242 on the Dow are likely to be revisited. There's also off course the risk of another 40+ volatility spike day so the key message is that of increased volatility following the steady bull run from the Feb lows into the late April peak.
VOLUME - Volume has remained WEAK throughout the rally, which has been one of the main reasons why so much commentary has been bearish during the past 12months. However it is perfectly inline with that of a stealth bull market and also implies that this rally has mostly not been bought into. Therefore I continue to expect heavier volume on the declines and lighter volume on the rallies.
SEASONAL TREND - Sell in May and Ago Away is here in force as elaborated in my March 23rd analysis. Weakness from a seasonal prospective could continue into September, with a possible low in early October followed by a sharp rally into December. Therefore the seasonal trend continues to match the actual chart trend. The Seasonal pattern is also virtually identical to Time Analysis.
PRESIDENT CYCLE YEAR 2- The impact of the 2nd year of the presidential cycle on the stock market is for a weak trend into September, and a rally in the fourth quarter into the end of the year for a small average gain for the year, which is starting to match the most probable outcome for the year.
Stock Market Conclusion
Despite the flash in the pan crash and prevailing Eurozone sovereign debt default gloom and doom, the bottom line is that this is still a stocks bull market with the Dow ONLY down less than 6% from its bull market peak. Therefore the sum of the above analysis concludes towards the stocks bull market under going its most significant and a highly volatile correction since its birth in March 2009 (15 Mar 2009 - Stealth Bull Market Follows Stocks Bear Market Bottom at Dow 6,470 ). This correction could last for several months and may extend all the way into early October, which suggests that the next 2 months are going to see an ABC correction to be followed by a sideways price action between the extremes of 10,900 to 9,800 and so despite continuing wild gyrations I would not be surprised if the Dow is little changed from its last closing price of 10,620 in 2 months time (16th July 2010). Expectations remain for the bull market to resume its trend towards a target of between 12k to 12.5k by late 2010 after the tumultuous trading period over the next few weeks. I have tried to illustrate a more precise Dow forecast projection in the below graph, reality will probably end up being far more volatile.
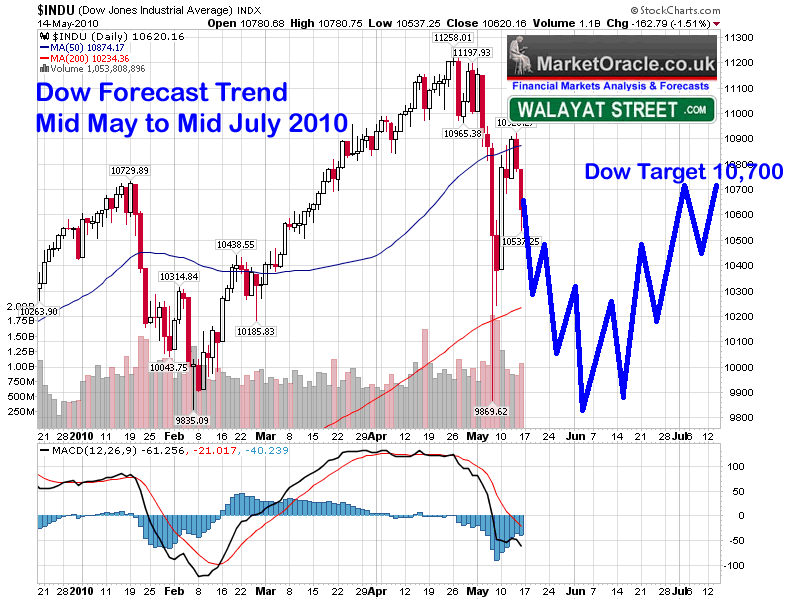
My next in-depth update will follow in about 2 months time with regular short weekly updates, so ensure your subscribed to my always free newsletter.
Risk to the Forecast - As indicated the support zone of 9,800 to 9850 should hold on repeated assaults, failure there would risk the Dow falling to just under 9,500 which would greatly weaken the scenario and prompt an in-depth update. The obvious trigger could be if European countries actually do start to default on their debts over the next 2 months which would result in a REAL stock market crash as we enter another Lehman's style contagion event where governments are forced to bailout their respective banking sectors that can only result in an acceleration of the Inflation Mega-trend.
Gold and U.S. Dollar Inverse Trend Myth Busted
Do you hear the deafening silence amongst the U.S. Dollar doom merchants ? Remember when you were being repeatedly and relentlessly told that it was impossible for the U.S. Dollar and Gold to BOTH Rise together ?
It was either Gold will Soar, and the Dollar will Crash, or that the Dollar would rise and Gold would Crash, but never that Gold AND the Dollar would rise together.
Well that's another market consensus myth well and truly busted, and there is little point now AFTER the fact, AFTER Gold and the Dollar have already risen to come to the realisation that okay Gold and the Dollar could rise together.
Gold is on track to achieve its forecast target of at least $1,333 this year (sooner rather than later), whilst it has traded to a new all time high in dollars, that's nothing compared to the levels seen Gold soar to when priced in sterling and euro's. My in depth analysis (02 Nov 2009 - Stocks, Dollar and Gold Bull Markets Inter-market Analysis ) concluded in strong bullish trends for Stocks (9,712), Gold ($1046) AND the U.S. Dollar (76.36), which prompted many emails and comments that my analysis must be wrong as there existed a strong consensus view that Gold, Stocks and the Dollar CANNOT Possibly ALL move in the same direction. Well more than 6 months on, that is another market consensus myth well and truly busted, with many now concluding AFTER THE FACT that perhaps Gold and the Dollar COULD both rise together after all, since which both Gold and the Dollar have appreciated markedly.
The US Dollar bull market has already achieved its long standing target of USD 84, and is on route towards resistance at 89 which I am sure will puzzle many americans reading this as they full well know of the huge amounts of debt that the U.S. Government is busy issuing to finance its own budget deficit, this is the advantage of having the worlds reserve currency and as a consequence of Countries such as the UK and Eurozone adopting panic measures to INFLATE their economies and DEVALUE their DEBT through competitive currency devaluations (See Inflation Mega-trend Ebook - FREE DOWNLOAD ). It increasingly looks like the U.S. Dollar far from crashing as many have iterated during its stealthy rise, may in fact just be getting warmed up for what is to come as the Euro targets PARITY to the Dollar Yes that's right PARITY ! I will seek to update the U.S. Dollar bull market trend to cover the next 6 months within a week or so.
Your existing outside of the box analyst looking to pick-up cheap long-term investments during market panics.
Source: http://www.marketoracle.co.uk/Article19546.html
By Nadeem Walayat
Copyright © 2005-10 Marketoracle.co.uk (Market Oracle Ltd). All rights reserved.
 Nadeem Walayat has over 20 years experience of trading derivatives, portfolio management and analysing the financial markets, including one of few who both anticipated and Beat the 1987 Crash. Nadeem's forward looking analysis specialises on UK inflation, economy, interest rates and the housing market and he is the author of the NEW Inflation Mega-Trend ebook that can be downloaded for Free. Nadeem is the Editor of The Market Oracle, a FREE Daily Financial Markets Analysis & Forecasting online publication. We present in-depth analysis from over 500 experienced analysts on a range of views of the probable direction of the financial markets. Thus enabling our readers to arrive at an informed opinion on future market direction. http://www.marketoracle.co.uk
Disclaimer: The above is a matter of opinion provided for general information purposes only and is not intended as investment advice. Information and analysis above are derived from sources and utilising methods believed to be reliable, but we cannot accept responsibility for any trading losses you may incur as a result of this analysis. Individuals should consult with their personal financial advisors before engaging in any trading activities.
Nadeem Walayat Archive |
© 2005-2022 http://www.MarketOracle.co.uk - The Market Oracle is a FREE Daily Financial Markets Analysis & Forecasting online publication.


