Gold And Silver’s Big Move And The Very Special Circumstances That Causes It
Commodities / Gold and Silver 2010 May 11, 2010 - 11:06 AM GMTBy: Hubert_Moolman

 From October 2008 to date the gold price has performed rather well. It is up 77.6% from the intraday low of $682 on 24 October 2008. It is of course not the only good up since then; in fact most goods are quite well up in nominal dollar terms.
If a good is up in price 77% in a period of about 1.5 years it would probably be reasonable to expect at least a slowdown in the pace of price growth or even a gradual decrease. Unless, there are very special circumstances present, such as one could probably have in a case of hyperinflation or say an extreme sudden shortage of that good which cannot be immediately replenished etc. one would certainly not expect it to accelerate further at an even faster rate as before.
At this time the gold price exist in a market where there are just such very special circumstances present.
The gold price has been suppressed for at least 70 years, by the existence of fractional reserve banking and its related fiat monetary system (together referred to as the debt-based monetary system).
This debt-based monetary system has increased the money supply dramatically and by association debt levels. The debt based monetary system is on its last legs, and while it is still alive; gold, silver and certain real assets will soon adjust upwards in price (significantly) to compensate for the results (over valued financial or intangible assets) brought about by significantly increasing debt levels.
This upward adjustment will disrupt the world economy significantly and if it is quick it could ruin the world economy and collapse the debt-based monetary system.
The world is currently much like a man who has a long term loan which he has been using for many years to finance his lavish lifestyle. The loan has a net present value (owing) many times the net present value of all income he would likely be able to make even if he was able to live 2000 years. The terms are that the lender can call on the loan any time. The problem for him is that the lender is one just like him (in the same position). It is only a matter of time before it all comes down crashing.
Like I have said before, the crash is coming, there is nothing that can be done to stop it. I believe some of the pain associated with this crash as well as some of the significant threats can be countered by a worldwide debt forgiveness. Impractical as it is, it is probably the only solution that can meaningfully help manage the pain that will accompany this crash in debt and its creations. It could mainly help in that it can help people to focus their efforts on the critical aspects of the world’s economy, such as food supply and energy supply instead of fear brought about by the wholesale uncertainty. You will notice that I wrote people not governments.
It is like in Egypt before the 7 year famine. Once it was known, that the 7 year famine was coming as well as when it was coming, people could focus on saving food for the famine period.
A well timed and organized debt forgiveness might provide a similar scenario, in that it may help many to prepare like Egypt did since it would remove a significant amount of uncertainty and the element of surprise.
So, we are indeed at a point in time where extremely special circumstances are present, circumstances that are extremely bullish for gold. Fundamental are thus telling me that gold and silver of course could take off to a series of higher highs month after month at any time now.
My technical analysis, in particular my fractal analysis is telling me that we are now in that big move. See below, I have included analysis I sent to my subscribers on 17 April 2010.
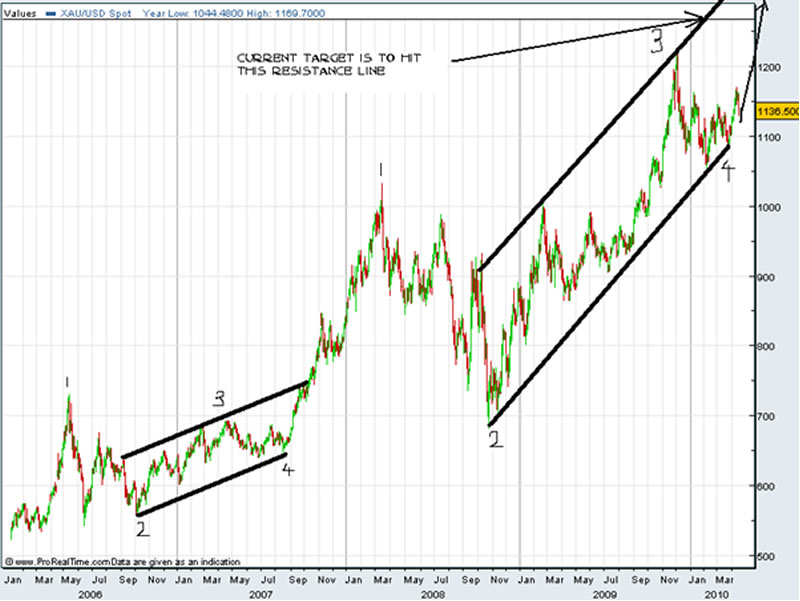
Below is a 4 year chart of the gold price.

There are basically 2 patterns or fractals on this chart which are potentially matching. I have marked them as 1 to 4. You will see the 1st pattern is smaller than the 2nd. You will also notice that the two patterns are not exactly the same, but there is a similarity.
To identify these patterns one has to use a combination of traditional geometry as well as, more importantly, an “artistic eye”.
WARNING -It is very important to know that one has to be aware of the bigger picture, or longer term chart (fractal analysis) and that this shorter term analysis is consistent with what the longer term analysis is indicating. The longer term analysis is not the subject of this document, however, I am satisfied that it is consistent with this analysis, in order that we can possibly assume the same outcome for these patterns.
So currently we have potentially just hit point 4 at the end of March 2010, and gold should be working its way up to the resistance line, in a relatively accelerating manner.
At this moment, that target could be just over the $ 1300 dollar level, but it should be clearer closer to the time.
Silver
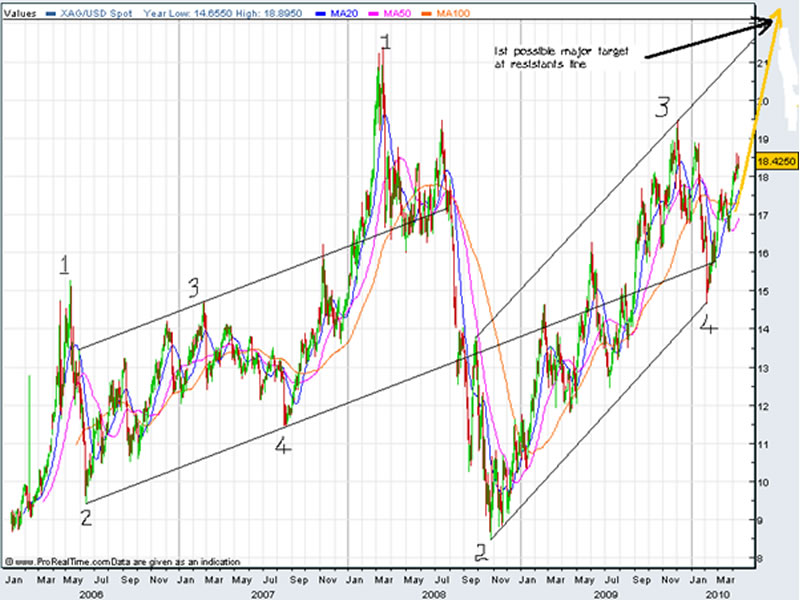
Below is a 4 year chart of Silver

The same as for gold, there are basically 2 patterns or fractals on this silver chart which are potentially matching. I have marked them as 1 to 4. You will see the 1st pattern is smaller than the 2nd. You will also notice that the 2 patterns are not exactly the same, but there is a similarity.
Same as for gold, I am satisfied that this analysis is consistent with the long term analysis.
So currently we have potentially just hit point 4 at the end of January 2010, and silver should be working its way up to the resistance line, in a relatively accelerating manner.
At his moment, that target could be just over the $ 21.50 dollar level, but it should be clearer closer to the time.
Closing Comments
I hope this is of use as regards the outlook for the gold and silver market as well as applying it in future analysis.
If you are interested in learning more about fractal analysis, subscribe to my free newletter (see below).
For more on where gold is going after the $ 1300 - $ 1350 level you can purchase my Long Term Gold Fractal Analysis Report for $50 (email me for details).
***
If you find this information useful, please forward it to friends or family so that I can continue to reach people that would not normally read such informative sites as this one. If you would like to subscribe to my newsletter please send me an email. My newsletter is free and I send it out whenever I have something to “say”. I do accept donations though, so that I can continue to research and write; email me for how.
Do not forget to visit my blog, since I publish additional articles there, on a regular basis: http://blogs.24.com/hubertmooolman
May God bless you.
Hubert Moolman
You can email any comments to hubert@hgmandassociates.co.za
© 2010 Copyright Hubert Moolman - All Rights Reserved
Disclaimer: The above is a matter of opinion provided for general information purposes only and is not intended as investment advice. Information and analysis above are derived from sources and utilising methods believed to be reliable, but we cannot accept responsibility for any losses you may incur as a result of this analysis. Individuals should consult with their personal financial advisors.
© 2005-2022 http://www.MarketOracle.co.uk - The Market Oracle is a FREE Daily Financial Markets Analysis & Forecasting online publication.


