


Does Today’s Stock Market Gap Up Change Everything?
Stock-Markets / Stock Markets 2010 May 10, 2010 - 03:34 PM GMTBy: David_Grandey

 Does this change everything? Maybe and maybe not. It’s too soon to tell. But what we can tell you is that today’s news driven event has averted a full blown meltdown and has now taken the indexes back up to overhead supply and resistance levels. A lot of individual names are also showing this. So that said, we’re not going to say we are out of the woods just yet as we are pushing some resistance.
But for now, we return you to our regularly scheduled programing — MAYBE. We say maybe as this move has just taken us right back up to resistance levels we’ve laid out over the weekend. We’ll have to see what some chart time does first. 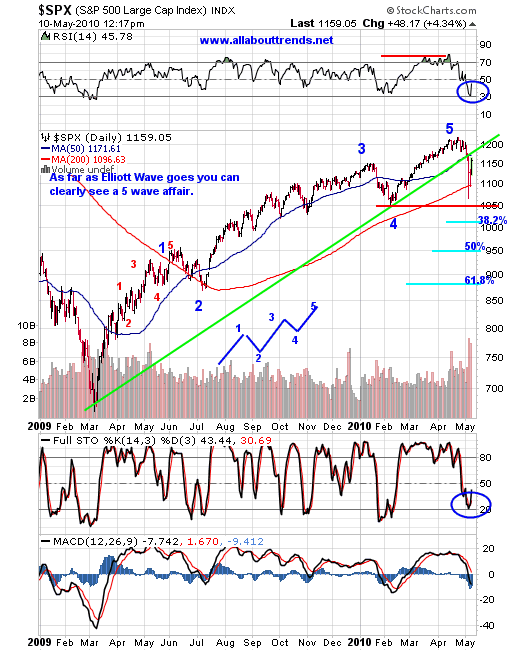
As you can see from the chart above, the SPX is backtesting a trendline break in the form of a potential KODR — Kiss Of Death Retracement. A KODR is what we call an issue that has broken an uptrend and comes back up to kiss the underside of the uptrend it’s just broken only to be turned away and tends to roll right right back over to the downside shortly thereafter. Call it a trendline break to the downside with a snapback rally.
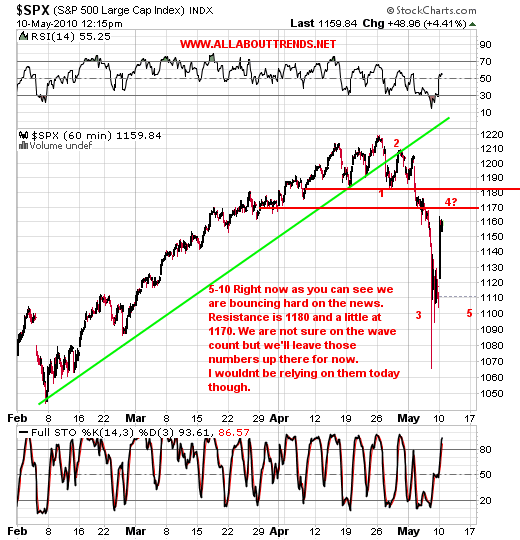
You can also see the 50 day average is at 1171 ish. The chart below in 60 minute time frequency shows a red resistance level at 1170 ish and that is the 50 day. You also see a fair amount of resistance at 1180.
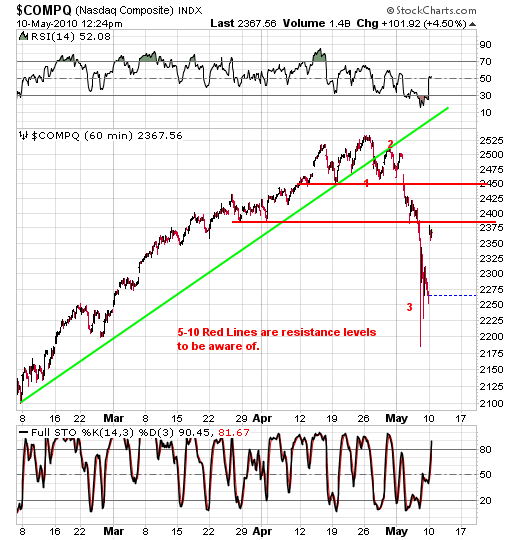
As for the OTC Comp:
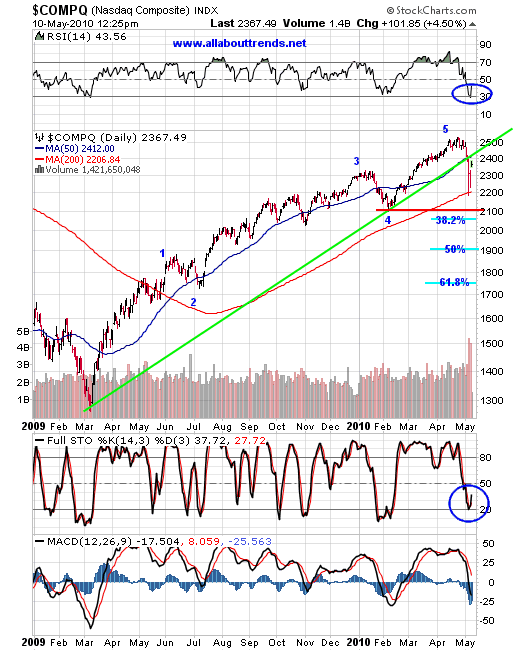
Here too the daily chart of the OTC Cop shows the same thing as the S&P 500 index. That of bouncing up against the 50 day average and the KODR — Kiss Of Death Retracement.
Numerous places in our newsletter over the weekend we said:
“Inverse ETFs-Buying them now in the short term is late to the party. Unless you are a day trader and can be in out and gone at the speed of a High Frequency Trader you might be wise to let the dust settle and for them now to stage Pullbacks Off Highs (POH) patterns on the longside.
Right now we want to stay away from chasing buses on the short side. We want to focus upon the long side as it’s what we’ve been setting up for for a few weeks now and here we are. You sure do NOT want to short these names as doing so is chasing a bus and AFTER the fact.
Short Side Positions - Remember folks we do not chase buses, we let them come to us. right now going short is the equivalent of chasing a bus.
We’ll stick it out right here with all of our long positions as like we said 90% of this could already be over.”
Now you know why. We still are not out of the woods as the opening volley has taken us right back to an area of overhead supply. Volatility still reigns supreme so we’ll have to see what things look like once the dust settles. Then we can get a gauge as to what is the most likely path to follow.
By David Grandey
www.allabouttrends.net
To learn more, sign up for our free newsletter and receive our free report -- "How To Outperform 90% Of Wall Street With Just $500 A Week."
David Grandey is the founder of All About Trends, an email newsletter service revealing stocks in ideal set-ups offering potential significant short-term gains. A successful canslim-based stock market investor for the past 10 years, he has worked for Meriwest Credit Union Silicon Valley Bank, helping to establish brand awareness and credibility through feature editorial coverage in leading national and local news media.
© 2010 Copyright David Grandey- All Rights Reserved Disclaimer: The above is a matter of opinion provided for general information purposes only and is not intended as investment advice. Information and analysis above are derived from sources and utilising methods believed to be reliable, but we cannot accept responsibility for any losses you may incur as a result of this analysis. Individuals should consult with their personal financial advisors.
© 2005-2022 http://www.MarketOracle.co.uk - The Market Oracle is a FREE Daily Financial Markets Analysis & Forecasting online publication.