


Gold Latest Activity Looks Too Good To Be True
Commodities / Gold and Silver 2010 May 09, 2010 - 04:55 AM GMTBy: Merv_Burak

 The saying “looks too good to be true” just seems to fit the latest gold activity. I like the action but something just doesn’t jive. Maybe it’s that (lack of) momentum (strength) behind the recent stock price action. Love it while it’s there but always be on guard.
GOLD LONG TERM
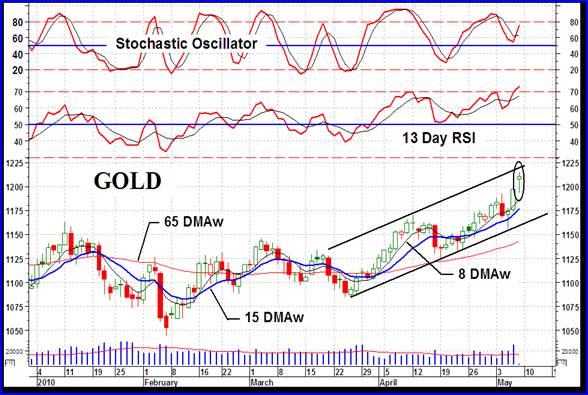
All we need is a quick reference to the point and figure action. It remains quite bullish and everything said last week still holds. Gold continues on its way towards my long term projection of $1600, with a couple of lower projections along the way.
As for where we are with the normal indicators, well they are all positive. The price of gold remains above its positive sloping long term moving average line. The momentum indicator remains in its positive zone above its positive sloping trigger line. The volume indicator continues to make new all time highs and remains above its positive trigger line. Nothing controversial here, the long term rating remains BULLISH.
INTERMEDIATE TERM
Everything is roses on the intermediate term. Gold is above its positive moving average line. Momentum is in its positive zone above its positive trigger line. Volume indicator is moving higher above its positive trigger line. What more is there to say? The intermediate term rating remains BULLISH. The short term moving average line continues to move above the intermediate term line for confirmation of the rating.
SHORT TERM
Looking at the short term indicators everything here is rosy also. However, looking elsewhere we see some signs of short term caution. These are indicators more along the line of predictive indicators rather than those which tell you where we are at any point in time, which are my normal indicators.
First, we have an up trending short term channel. The price is just about touching the upper resistance trend line. This suggests that we might expect a topping process to start about here. The price could still go a little higher but to stay in the channel, not too much higher. The price does not have to drop from around here but it is expected to at least top out and at the least head laterally for a while.
The other indicator that jumped out at me today was the Friday’s action as shown by the candlestick. I have circled the candlestick in question. This candlestick has a variety of names, at least three that seem to apply. One applies when the candlestick occurs during a down trend. One applies when the candlestick occurs at a support point. These do not seem to be the case here. The last applies during an up trend and seems to be the most applicable. It is called a HANGING MAN candlestick (no, there is no hanging woman candlestick). The hanging man is a bearish candlestick during an up trend so we might expect a turn around in the price action very soon. How long such action might last is anyone’s guess.
Despite these predictive patterns if I was a short term gold trader I don’t think I’d go out and sell everything but would be very cautious ready to sell and not inclined to buy anymore gold for now.
As for the normal short term indicators which tell us where we are at this point in time, the price remains above its positive moving average line and the momentum indicator remains well inside its positive zone above its positive trigger line. The momentum indicator is, in fact, moving inside its overbought zone preparing for some type of turn around ahead. The daily volume activity has been perking up these past few days and looks positive. All in all, the present short term rating remains BULLISH.
Trying to guess the immediate direction of least resistance on a week-end, when anything on the international scene could change drastically, is fraught with danger but I’ll try. Keeping in mind those two predictive indicators just discussed there is one more to consider. The Stochastic Oscillator has been showing weakness in the recent gold action, despite the price moves. The new price high on Monday was not confirmed by the SO and the end of week move into new highs is still not being confirmed by the SO action. The strength behind the price moves may not be what one expects from the voracity of the price move these past couple of days. I’m inclined to go with the downside as the most likely direction over the next few days.
SILVER
I’m always cautious when told that two stocks or commodities are very similar and will act together. There are always some differences which at one point or another may come into play and cause the two to act differently no matter how “similar” they may be. So it is with gold and silver. Both are “precious” metals and therefore are expected to act together. Most of the time that may be so but not always. What are the differing features of the two that may make them act differently under some circumstances? The biggest difference between these two metals is that silver has a large industrial function and depends greatly upon the world’s economy for its use. Economy great, silver in great demand. Economy not so great, industrial demand weakens and demand for silver becomes less. Maybe that’s what’s happening lately with the collapse of the Greek finances and the fear that this will lead to a reduction of economic activity, not only in Greece but world wide. Of course economic turmoil causes gold to move higher.
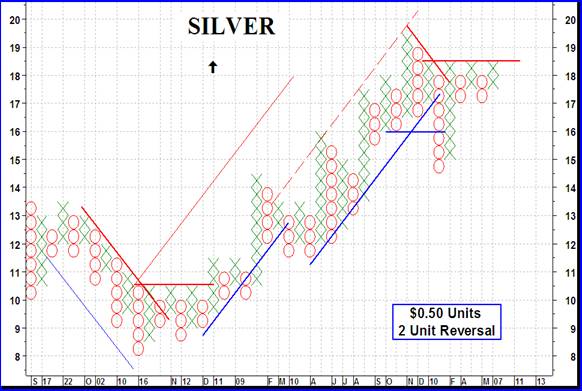
Looking at the P&F chart for silver we see that we still DO NOT have a bullish reversal on the chart. Silver must move to the $19.00 level before a break-out on the up side can be declared, P&F wise. That could happen momentarily but one would wait for it and not plunge ahead of the occurrence, if one were purely a P&F addict. There are other indicators of trend one can go to and these might give a different story. Let’s look at them.
On the long term silver is bouncing off its long term moving average line. It is above the line and the line is pointing upwards. The long term momentum indicator remains in its positive zone but it had dropped below its trigger line during the week. It closed on Friday just above the trigger but the trigger is still in a slight negative slope. As for the volume indicator, it has been moving higher and remains above its positive trigger line. All in all the long term rating remains BULLISH.
On the intermediate term there are a few indicators in addition to our normal ones. Since Feb silver, the momentum indicator and the volume indicator have all been in up trends above well defined up trend lines. During the week all three broke below their respective up trend lines for a negative move. On Friday the price moved above its previous up trend line. The momentum indicator is basically on its line while the volume indicator is still below its up trend line. In addition, while the price was making a consistent higher highs and higher lows pattern this past week’s action changed that and a lower low was established. As for the normal indicators, silver price is above its positive moving average line. The momentum indicator has just closed above its trigger line in the positive zone but the trigger is still pointing downward. The volume indicator is showing some weakness and is below its negative trigger line. Putting it all together the intermediate term rating is still BULLISH but showing weakness. The short term moving average line remains well above the intermediate term average for confirmation of the rating.
On the short term things change fast. During the week as the price moved lower the short term indicators turned negative. On Friday the price of silver gained considerably putting the price back above its moving average line with the line slope turning upwards at the same time. The momentum indicator had moved into its negative zone during the week but bounced above the neutral line on Friday. The momentum also closed above its trigger line but the trigger remains pointing downward. The daily volume action suggests more interest on the down side than the up side although I do not have Friday’s volume to see how it acted on this upside move. All in all, although negative during the week the short term rating turned BULLISH again on Friday.
PRECIOUS METAL STOCKS
There seems to be quite a disconnect this week between the actions of gold stocks and the metal. In addition, there is a disconnect between the “quality” stocks and the more speculative kind. On a one week basis it is not really unusual for gold price and stock prices to diverge. What we have to watch out for is if this divergence in price goes on for any length of time. It is assumed that stock prices often lead the metal price so if the stock prices should continue lower that would not be good for the price of gold.
We have a similar situation with the quality and speculative stocks. At market tops it is a common occurrence that the more speculative stocks top out first, followed sometimes later by the quality sector. I have mentioned this phenomena in the past as between the general universe of stocks versus the penny stocks as represented by my Merv’s Penny arcade Index.
Last week I showed a long term chart of the overall Merv’s Gold & Silver 160 Index. This chart showed how the momentum of the Index has been diminishing over the past few years and that this decrease in momentum cannot continue for much longer without going into a long term bear market. It did go bearish for a short time but reversed again. This week a further weakening is shown in the momentum as the Index went lower despite a positive gold move.
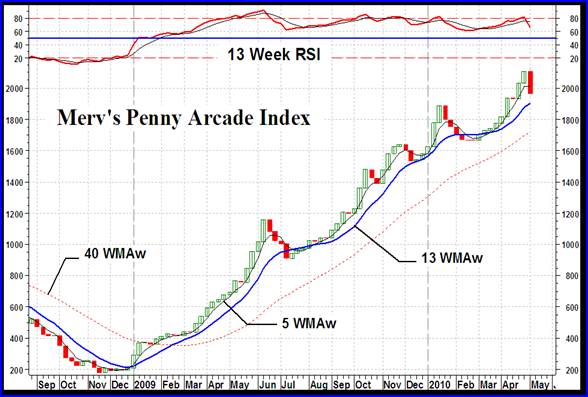
We see this same weakening in momentum going on in the penny stocks. Over the past year each new move into new high ground made by the Merv’s Penny Arcade Index was made by a continuing reduction of momentum strength. The intermediate term momentum has remained in its positive zone since Jan of last year. The intermediate term moving average line has remained in a positive slope during this time. Both are still showing a positive sign but must be watched just in case the down trend should last for more than a few weeks.
Except for the Merv’s Qual-Silver Index, all other Merv’s Indices have moved into new bull market highs, most into new all time highs. Of concern for the continued bullishness of the stocks is the fact that every Index is showing a long term negative divergence. This usually precedes a reversal of trend into a bear market but it is not a sure thing yet. More watching and waiting ahead.
Many of the Indices are showing a negative trend, or at least a trend towards the negative. Although there may still be much upside to the stocks ahead one must keep in mind that from here, until something changes in the indicators, the odds are getting more into the risky side for investing or speculating on the up side and one must always have their exit strategy in place BEFORE getting in on the up side (or down side).
Merv’s Precious Metals Indices Table
Well, I think I’ll call it a day.
By Merv Burak, CMT
Hudson Aero/Systems Inc.
Technical Information Group
for Merv's Precious Metals Central
For DAILY Uranium stock commentary and WEEKLY Uranium market update check out my new Technically Uranium with Merv blog at http://techuranium.blogspot.com .
During the day Merv practices his engineering profession as a Consulting Aerospace Engineer. Once the sun goes down and night descends upon the earth Merv dons his other hat as a Chartered Market Technician ( CMT ) and tries to decipher what's going on in the securities markets. As an underground surveyor in the gold mines of Canada 's Northwest Territories in his youth, Merv has a soft spot for the gold industry and has developed several Gold Indices reflecting different aspects of the industry. As a basically lazy individual Merv's driving focus is to KEEP IT SIMPLE .
To find out more about Merv's various Gold Indices and component stocks, please visit http://preciousmetalscentral.com . There you will find samples of the Indices and their component stocks plus other publications of interest to gold investors.
Before you invest, Always check your market timing with a Qualified Professional Market Technician
Merv Burak Archive |
© 2005-2022 http://www.MarketOracle.co.uk - The Market Oracle is a FREE Daily Financial Markets Analysis & Forecasting online publication.