


This Stocks Short Sell Pattern Is All You Need To Know
InvestorEducation / Learn to Trade May 06, 2010 - 08:37 AM GMTBy: David_Grandey

 One classic and often explosive short-sell pattern we want to be on the lookout for is that of a First Thrust Down, Snapback Rally Bombs away pattern. Below is one such example with more further in this post.
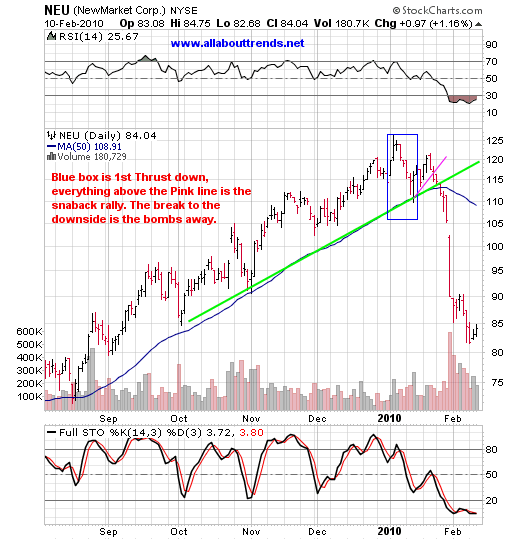
We cannot stress how important this pattern is. IF we see this same set-up transpire in the indexes over the next few days or even week/weeks we want you to be prepared and know what to do because it would be a HUGE OPPORTUNITY on the short side.
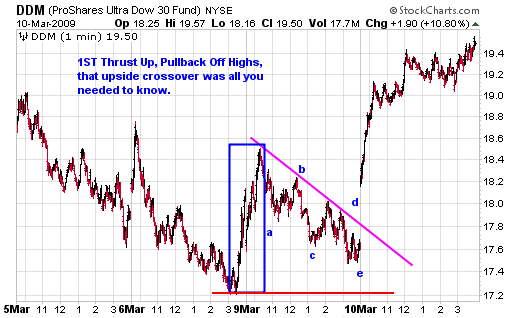
As far as INVERSE ETFs are concerned for those of you who can not short in an IRA the chart below is a good example as it would be a 1st Thrust Up, pullback off highs and away we go to the upside in those inverse ETFs. This example just so happens to be of the March 2009 lows in a nano time frequency. No matter as this pattern like more others shows up in all time frames and frequencies.
What we are looking for in the indexes is a short-term bounce and then failure. Should we get that odds favor you haven’t seen nothing yet to the downside and it would then be “Welcome to a full blown correction” in the least. Market leaders can easily get whacked 30-40% in these type of corrections. Just look at CLF up until Wednesday. That issue hit a high of 75 and over the last week or so has gone to a low of 53.
================================================
First Thrust’s Down
Below for your viewing pleasure are a few examples of First Thrust down patterns.
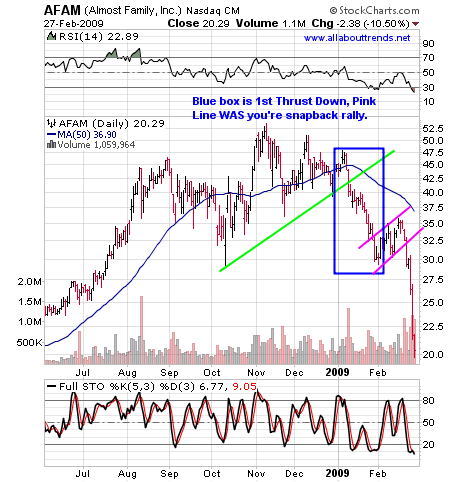
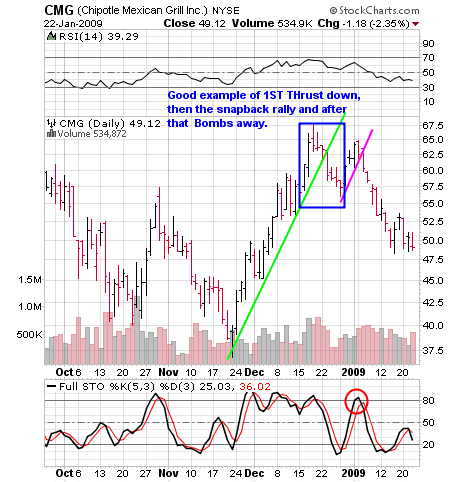
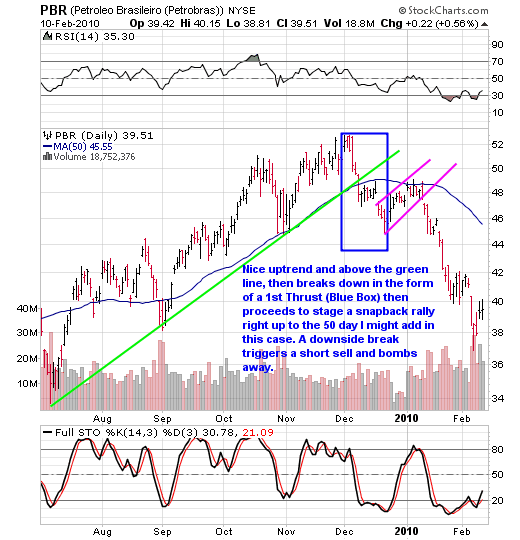
As you can see in each of these cases a downside break of the pink line AFTER a snapback rally was all you needed to know.
Should this pattern show up in the indexes the long side of your account is probably going to show some serious pain.
But the short side of your portfolio will pick up the slack. And for those of you who trade in tandem with the market you’ll be having a lot of fun all the while the buy and holders get it handed to them.
By David Grandey
www.allabouttrends.net
To learn more, sign up for our free newsletter and receive our free report -- "How To Outperform 90% Of Wall Street With Just $500 A Week."
David Grandey is the founder of All About Trends, an email newsletter service revealing stocks in ideal set-ups offering potential significant short-term gains. A successful canslim-based stock market investor for the past 10 years, he has worked for Meriwest Credit Union Silicon Valley Bank, helping to establish brand awareness and credibility through feature editorial coverage in leading national and local news media.
© 2010 Copyright David Grandey- All Rights Reserved Disclaimer: The above is a matter of opinion provided for general information purposes only and is not intended as investment advice. Information and analysis above are derived from sources and utilising methods believed to be reliable, but we cannot accept responsibility for any losses you may incur as a result of this analysis. Individuals should consult with their personal financial advisors.
© 2005-2022 http://www.MarketOracle.co.uk - The Market Oracle is a FREE Daily Financial Markets Analysis & Forecasting online publication.