Traditional Stocks Bull Market Affects
Stock-Markets / Stock Markets 2010 May 04, 2010 - 01:03 PM GMTBy: Donald_W_Dony
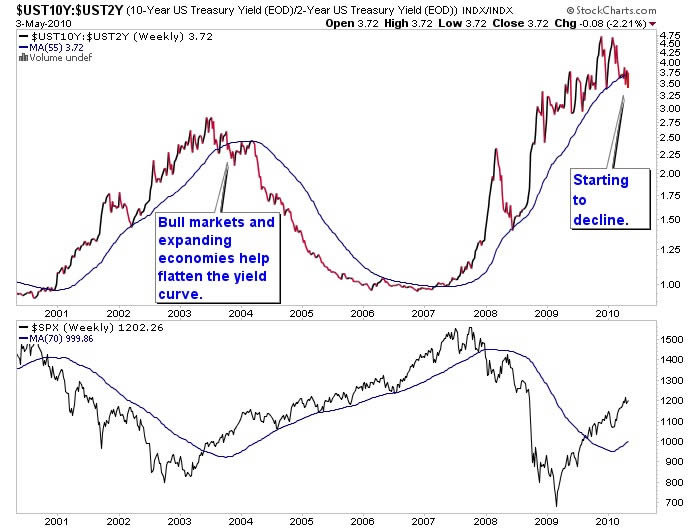
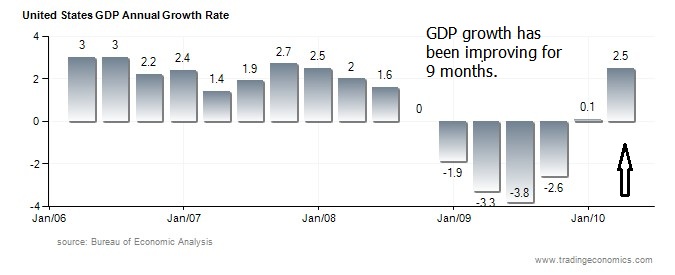
 The traditional affects of an expanding economy and a bull market have finally reached the yield curve. After nine months of positive GDP growth in the US economy and over 12 months of steady advances in the S&P 500, the yield curve is beginning to flatten. This action normally starts within the first 12 to 18 months of a bull market and its presence now is right on schedule.

Yield curves gradually steepen during economic contractions and bear markets. Central banks cut interest rates in an attempt to help ward off recessions and help stimulate the economy. As an economy bottoms and begins to recover, short-term rates slowly start to rise before long-term rates. This action gradually begins the long process of flattening the curve. Central banks periodically increase interest rates to help maintain longer growth and curb the risk of future inflation. By the end of a bull market and near a top in the business cycle, the yield curve is basically flat (Chart 1). As GDP stalls and begins to fall (Chart 2), the process of rate reduction and steepening of the yield curve starts again.

This standard movement of flattening of the yield curve should help reinforce the idea that this current upward rise in the S&P 500 is not just a bear market bounce but rather the the early phase of a longer bull market.
Bottom line: The action of the yield curve and the movement of the stock market is a traditional pattern. Short-term yields can be expected to slowing advance now and continue throughout the present business cycle and bull market.
Investment approach: Long-term investors should recognize the important significance of the yield curve to the bull market. This correlation should help investors maintain a positive approach to equities over the course of this anticipated 2009-2013/14 equity advance. The yield curve should also act as an early warning to the next peak in the stock market. Flat yield curves generally develop 8 to12 months before the crest of a bull market.
Your comments are always welcomed.
By Donald W. Dony, FCSI, MFTA
www.technicalspeculator.com
COPYRIGHT © 2010 Donald W. Dony
Donald W. Dony, FCSI, MFTA has been in the investment profession for over 20 years, first as a stock broker in the mid 1980's and then as the principal of D. W. Dony and Associates Inc., a financial consulting firm to present. He is the editor and publisher of the Technical Speculator, a monthly international investment newsletter, which specializes in major world equity markets, currencies, bonds and interest rates as well as the precious metals markets.
Donald is also an instructor for the Canadian Securities Institute (CSI). He is often called upon to design technical analysis training programs and to provide teaching to industry professionals on technical analysis at many of Canada's leading brokerage firms. He is a respected specialist in the area of intermarket and cycle analysis and a frequent speaker at investment conferences.
Mr. Dony is a member of the Canadian Society of Technical Analysts (CSTA) and the International Federation of Technical Analysts (IFTA).
Donald W. Dony Archive |
© 2005-2022 http://www.MarketOracle.co.uk - The Market Oracle is a FREE Daily Financial Markets Analysis & Forecasting online publication.


