


Urgent: Don’t Make This Dangerous Natural Gas Stocks Investing Mistake
Commodities / Natural Gas May 04, 2010 - 11:22 AM GMTBy: Keith_Schaefer

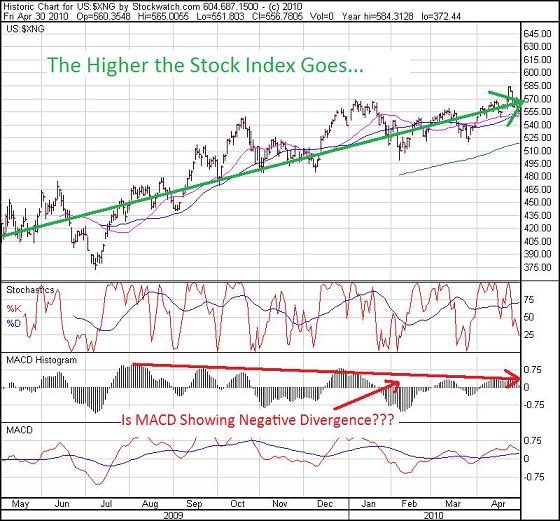
 Investors who are looking to the XNG:NYSE Natural Gas Index to tell them the future of natural gas prices could be making a costly mistake.
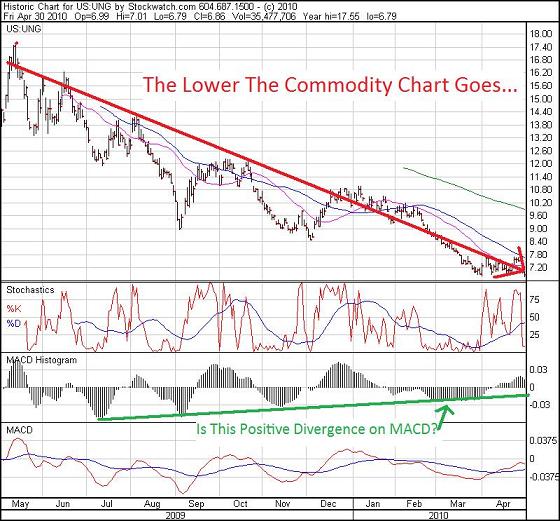
XNG:NYSE – which tracks large cap companies in the US natural gas industry – has been heading up for 12 months – in the directly opposite direction as UNG:NYSE, the high profile ETF that tracks the price of natural gas. It has been going down for 12 months, and set a new 52 week low late last week.
How can two related natural gas charts go in opposite directions for so long? Which one should investors look to try and make money?
UNG is supposed to track the natural gas commodity price in the US, based on the near month contract on the Henry Hub in Louisiana.
(There are several natural gas “hubs” where natural gas prices are quoted around the US, but the Henry Hub is what most media quote – and while there used to be a big difference between the regional hubs, increased pipeline capacity around the US has lowered those differences a lot.)
XNG measures the stock performance of a basket of large cap companies in the natural gas industry – but they are not all producers. Some are pipeline, transportation and transmission companies.
Look at the two charts, which at first blush I would expect to mirror each other – the underlying commodity and the equities that should track that commodity:
So what gives with that? Does one of these charts have to “give”, somehow?
The short answer is “not really”, and it has to do with how the index is made up, and how some of the companies in the index do business (I’ve listed them alphabetically at the bottom of this article).
Two of them, Kinder Morgan (KMP-NYSE) and Williams (WMB-NYSE) are pipeline companies, not natural gas producers. Now, the main reason the natural gas price is so low is because US production is increasing again after years of decline. So it only makes sense that if you are pumping more gas out, the pipeline companies are making more money.
The stock price of Kinder Morgan was going up anyway, but as soon as their Rockies Express pipeline from Colorado to Ohio went live last fall, their stock took off even more. They’re up more than 50% in the last 12 months. Williams is almost a double.
Second, several of the producers in the index have been very high profile about transforming themselves into oil-weighted companies as fast as they can find deals and if need be, raise the money. Apache Corp. (APA-NYSE) spent $5 billion in just one week in April 2010 buying two sets of oil assets in the Gulf of Mexico (Too bad for them it was before the BP spill). Chesapeake (CHK-NYSE) has been very vocal since February that it wants to become a lot more oil weighted.
On February 25 2010, EOG Resources CEO Mark Papa said it “can no longer be considered primarily a natural gas company.” – and the stock jumped more than 25% in two months!
And of course XTO:NYSE is being bought out by Exxon (XOM:NYSE) for stock, so their stock will track Exxon – the largest independent oil company in the world – until that deal closes. XTO stock has nothing to do with the price of natural gas now.
And lastly, several of the companies are integrated producers, meaning they not only produce the gas out of the ground, (called the upstream business) but also have pipelines and other infrastructure that deliver the gas to customers (called the downstream business). As I mentioned with the pipeline companies – they’re doing a lot better.
So, for those reasons, the XNG stock index and the UNG commodity index – even though they’re both tracking different parts of the natural gas industry – don’t necessarily have to have a tight, direct relationship.
Investors could be tempted to look at XNG, and because stocks lead commodity prices – the market usually predicting where prices will be 9 weeks to 9 months out – as a barometer of where natural gas prices could be in the future. But the XNG has pipeline companies, and several producers who are moving away from natural gas as fast as they can. It’s not just natural gas producers.
So that investment hypothesis could be a costly mistake.
The XNG index is currently made up of:
APA – Apache Corp.
APC – Anadarko Petroleum Corp.
CHK – Chesapeake Energy Corp.
DVN – Devon Energy Corp.
EOG – EOG Resources
EP – El Paso Energy Corp.
GAS – Nicor Inc.
NBL – Noble Energy Inc.
NFG – National Fuel Gas Company
NI – NiSource Inc.
STR – Questar Corp.
SWN – Southwestern Energy Corp.
UPL – Ultra Petroleum
WMB-Williams Companies Inc.
XTO – XTO Energy
Latest Interview! To listen to Keith Schaefer on Korelin Economics Radio, April 30, 2010, please visit: http://www.kereport.com/weekendshow/weekendr-may0110-seg6.html
About Oil & Gas Investments Bulletin
Keith Schaefer, Editor and Publisher of Oil & Gas Investments Bulletin, writes on oil and natural gas markets - and stocks - in a simple, easy to read manner. He uses research reports and trade magazines, interviews industry experts and executives to identify trends in the oil and gas industry - and writes about them in a public blog. He then finds investments that make money based on that information. Company information is shared only with Oil & Gas Investments subscribers in the Bulletin - they see what he’s buying, when he buys it, and why.
The Oil & Gas Investments Bulletin subscription service finds, researches and profiles growing oil and gas companies. The Oil and Gas Investments Bulletin is a completely independent service, written to build subscriber loyalty. Companies do not pay in any way to be profiled. For more information about the Bulletin or to subscribe, please visit: www.oilandgas-investments.com.
Legal Disclaimer: Under no circumstances should any Oil and Gas Investments Bulletin material be construed as an offering of securities or investment advice. Readers should consult with his/her professional investment advisor regarding investments in securities referred to herein. It is our opinion that junior public oil and gas companies should be evaluated as speculative investments. The companies on which we focus are typically smaller, early stage, oil and gas producers. Such companies by nature carry a high level of risk. Keith Schaefer is not a registered investment dealer or advisor. No statement or expression of opinion, or any other matter herein, directly or indirectly, is an offer to buy or sell the securities mentioned, or the giving of investment advice. Oil and Gas Investments is a commercial enterprise whose revenue is solely derived from subscription fees. It has been designed to serve as a research portal for subscribers, who must rely on themselves or their investment advisors in determining the suitability of any investment decisions they wish to make. Keith Schaefer does not receive fees directly or indirectly in connection with any comments or opinions expressed in his reports. He bases his investment decisions based on his research, and will state in each instance the shares held by him in each company. The copyright in all material on this site is held or used by permission by us. The contents of this site are provided for informational purposes only and may not, in any form or by any means, be copied or reproduced, summarized, distributed, modified, transmitted, revised or commercially exploited without our prior written permission.
© 2010, Oil & Gas Investments Bulletin
Contact Us:
Email: nichola@oilandgas-investments.com
Customer Service: 1-877-844-8606
www.oilandgas-investments.com
© 2005-2022 http://www.MarketOracle.co.uk - The Market Oracle is a FREE Daily Financial Markets Analysis & Forecasting online publication.