Nasdaq NDX Tek Stock Index Weekly Analysis
Stock-Markets / Stock Markets 2010 May 01, 2010 - 05:57 PM GMTBy: Piazzi
 “In the middle of the journey of our life, I came to myself within a dark wood where the straight way was lost.”– From The Divine Comedy by Dante Alighieri
The way they talk it in the media, it sounds like Greece is the end of the world, Portugal the purgatory, and Spain the Hell.
And, of course, there is the Goldman-Sec saga – what a circus!
Is it really that bad? Who knows?
Markets ebb and flow. Every ebb is touted as the end of times, and every flow as an all-inclusive package to Shangri La – and, thus, the quote from The Divine Comedy
----------------
This is a weekly chart of NDX
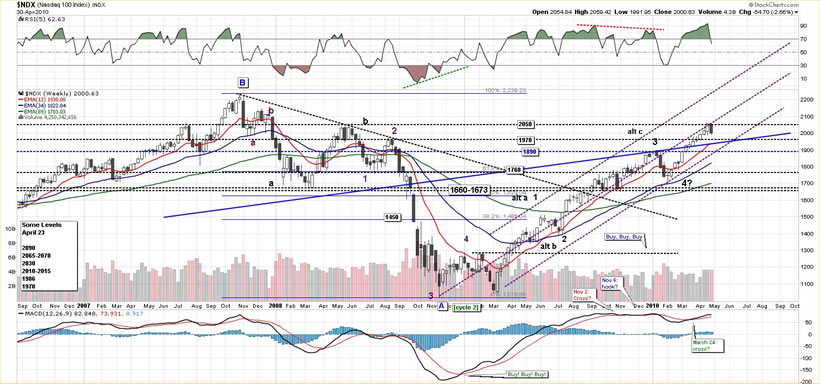
That’s an ugly candle at the end of the chart. NDX hit the resistance around the top of our 1970-2050 range and was knocked back. Actually, it tested the top twice on the daily frame.
1970 area remains a support level. It would be ideal if index could stay in the range so that the blue actionary line and the 13 EMA could catch up with the 1970 area.
Here’s a daily chart
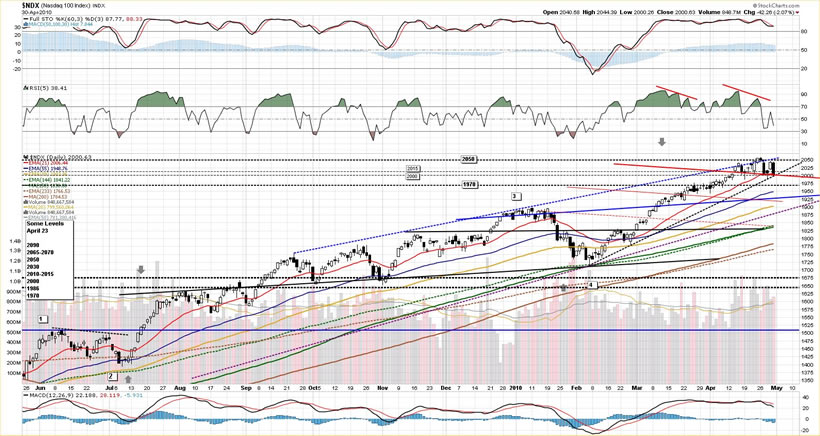
Price is in a zone formed by a short term trend line (dashed black), a dashed blue line resistance line, a red actionary line and the 21 EMA. Both bulls and bears need to get the index out of this zone to get some momentum on their side.
The daily technicals look ominous and urgently require the bulls to step in and bid the tape. Bears have a chance, once again, to, at least, create a meaningful correction. Regardless of what market animals do, I still believe that as long as NDX is in the 1970-2050 range it is either rallying (which apparently is not the case right now) or consolidating.
Bears need to break below 1970 and hold it – it’s that simple.
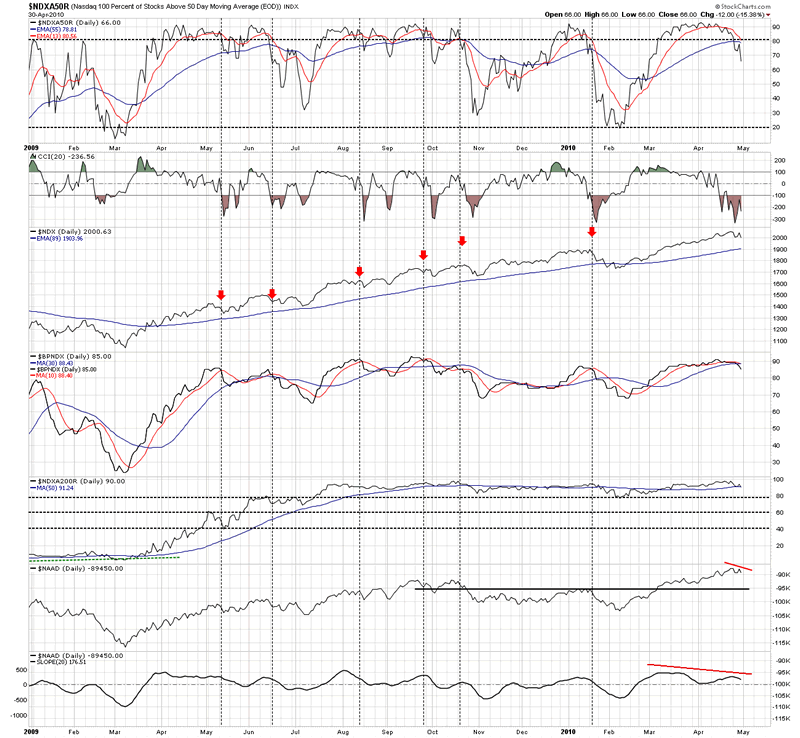
On April 24, I posted this chart
And said
“Since March 2009, every time Bullish Percent Index crossed below its MA 10, NDX had some sort of correction”
Well, NDX did correct – a scary tumble early in the week that cut through a lot of short term support levels, then a hard bounce on the back of shaky shorts, and then another tumble on Friday – the last day of the week, and the month.
On Thursday, before market open, I made a quick post saying
“Internally, the market is still very oversold. Not as oversold as Monday but still oversold.
……
So, the bounce has a good chance to continue. But it is hard to say if market has bottomed for another multi-day (if not multi-week) advance or whether this is just a dead-cat-bounce.”
The bounce continued on Thursday and also in the future market all the way into Friday’s open. Then, the market went soft and sold down the Friday.
Breadth oscillators are in a downtrend
The bounce lifted the oscillators but was not enough to snap the oscillators’ downtrends.
Index still needs a push, the short squeeze rally of Wednesday and Thursday burnt out too fast
Before moving to 60-min chart, let’s have some fun with regression
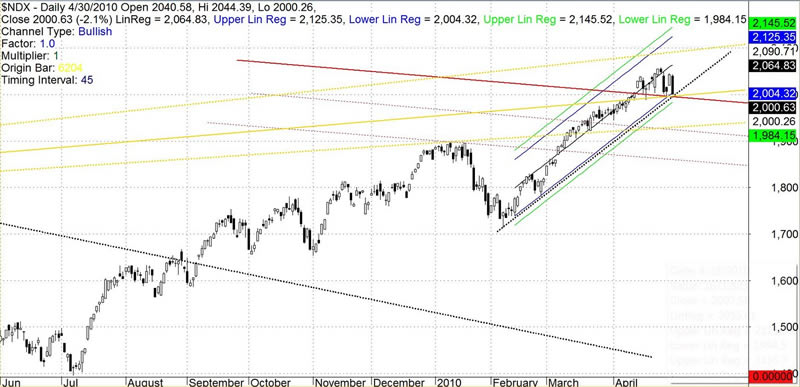
Index is at the bottom range of a 55-period regression channel that has defined the advance since Feb low. The red actionary lines are from my other daily chart and the intersection of the top red line and bottom of the regression channel and the short term trend line (dashed black) looks like a very interesting junction. I have also added some longer term actionary lines (yellow). The middle line goes right through the intersection of other lines, the top and bottom dashed yellow lines are currently at 1930 and 2090. If you remember, 2090 was a target level in case bulls could break above the 2050 area.
So, bulls need to hold this level and not violate the regression channel and the trend line. In case they fail, if one is still bullishly inclined, levels below 1930 may provide a put-sale strike when things get oversold enough for another bounce. I repeat the qualifier: If One is Still Bullishly Inclined.
Selling naked puts can be good way of getting into position if assigned but one better have, first, a plan for exit, and, second, the resources to cover losses if things go bad in a hurry. A more conservative approach might be to sell a put spread.
(This is not a recommendation. I do not make recommendations. I just talk idle talks to myself. Read the blog disclaimer)
Let’s have some more fun with regression
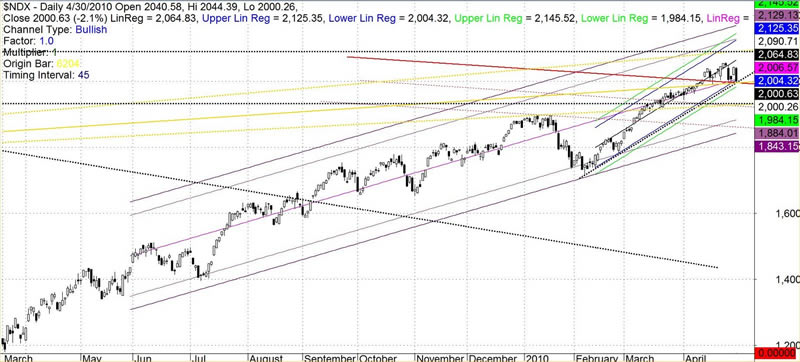
I have constructed a 233-period regression channel on the chart above and that has so far contained the advance since July low nicely. The middle line (the pink regression line) goes right through the intersection of all the other intersecting lines, which is where price stopped on Friday.
Interesting, eh?
Is NDX an index of technicians, or what?
well, enough regressing, or was I digressing?
This is a 60-min chart
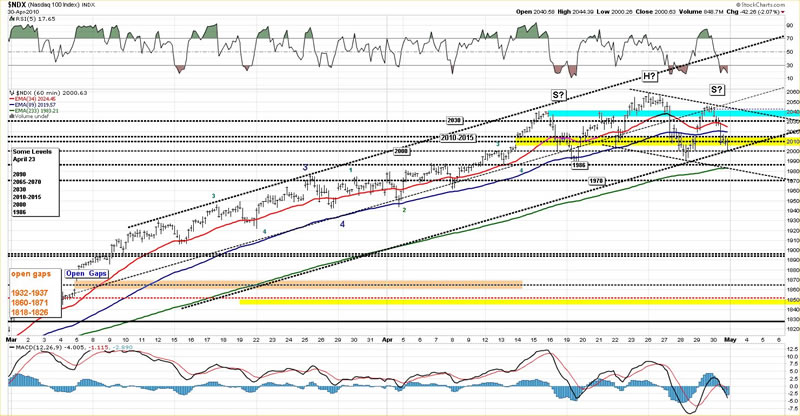
First off, it seems like we have a potential H&S in play. Potential does not mean certainty, just ask the bears who jumped on the H&S of June 2009 how they got their backs skinned.
Index had a violent week last week and is again oversold. Only time will tell if the violence is a shakeout or a distribution.
Notice that the overbought RSI could not get a new price peak. That usually is a sign of weakness.
Also notice that, last week, neither 34 nor 89 EMA offered any meaningful support or resistance and price cut through them with ease. That usually is a sign of price looking for new levels and a new short term trend.
Finally, notice that we have so far been in a range between 1986 and 2055, and currently close to the bottom of the range that has been tested twice.
Index is at the bottom of a channel that has so far done very well on the 60-min chart. It is oversold enough to catch a bounce, especially since we have a number of technical lines going through the current area of price as discussed on daily charts. I have started the skeleton of a down channel. If NDX is going to correct more deeply, the down channel may guide us through it – too soon to say, but I can just drop a line and see what happens.
My levels are still the same as I posted on Thursday
2030
2010-2015
2000
1986 (held the decline yesterday, it's around the lower boundary of the channel on 60-min chart)
1970
Enjoy The Rest of Your Weekend!
By Piazzi
http://markettime.blogspot.com/
I am a self taught market participant with more than 12 years of managing my own money. My main approach is to study macro level conditions affecting the markets, and then use technical analysis to either find opportunities or stay out of trouble. Staying out of trouble (a.k.a Loss) is more important to me than making profits. In addition to my self studies of the markets, I have studied Objective Elliott Wave (OEW) under tutorship of Tony Caldaro.
© 2010 Copyright Piazzi - All Rights Reserved Disclaimer: The above is a matter of opinion provided for general information purposes only and is not intended as investment advice. Information and analysis above are derived from sources and utilising methods believed to be reliable, but we cannot accept responsibility for any losses you may incur as a result of this analysis. Individuals should consult with their personal financial advisors.
© 2005-2022 http://www.MarketOracle.co.uk - The Market Oracle is a FREE Daily Financial Markets Analysis & Forecasting online publication.


