


Indian Stock Market Detailed Technical Analysis with Chart studies
Stock-Markets / India May 01, 2010 - 06:32 AM GMTBy: StocksBuddy

 As was expected, there were wild moves on both sides owing to Options expiration. Since largest OI was centered around 5200, Nifty hovered and closed pretty much near it. After trading in a very narrow range all of last week, it closed pretty much where it left the previous week. This shows the tug of war between bulls and bears. Neither sure which way to trade at the end of the day/week.
In our last analysis though we stated that there is chance of Negative Divergence building up and that would be give us two things.
As was expected, there were wild moves on both sides owing to Options expiration. Since largest OI was centered around 5200, Nifty hovered and closed pretty much near it. After trading in a very narrow range all of last week, it closed pretty much where it left the previous week. This shows the tug of war between bulls and bears. Neither sure which way to trade at the end of the day/week.
In our last analysis though we stated that there is chance of Negative Divergence building up and that would be give us two things.
- Confirmation that the trend down has started.
- Good entry point for going short.
Looking at the chart below it does infact looks like we are still in the process of building that negative divergence. On the price chart we have clearly formed a down-ward trend/channel. Indicators though are mixed. Some looking good, while others implying a potential sell-off in the coming week(s). US markets closed at LOD (low of the day) and were clearly down big time on friday. This will definitely have a negative impact on Asia open on monday.
Technically Speaking:
Take a look at the Daily Nifty chart below.
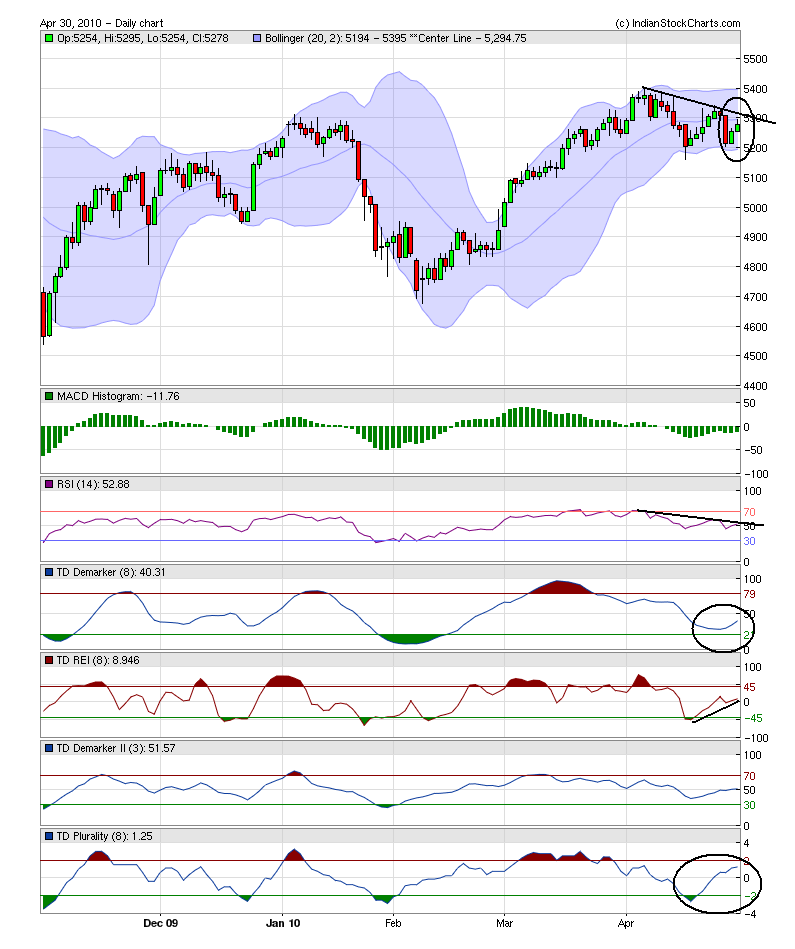
The above chart uses TD Demark indicators extensively.
Positives:
- RSI still above 50
- Almost all of the TD* indicators circling back nicely to the upside.
- MACD may be in the process of creating a positive divergence.
- The best of all, Nifty managed to close above center BB line.
- We have demonstrated the importance of BB center line. Anything that trades below this line, is a potential short. After have crushed through this line a few days back, nifty is finding it difficult to move back above it. Extremely negative.
- RSI, which is one of the most important indicators, is clearly showing negative divergence.
Next Week:
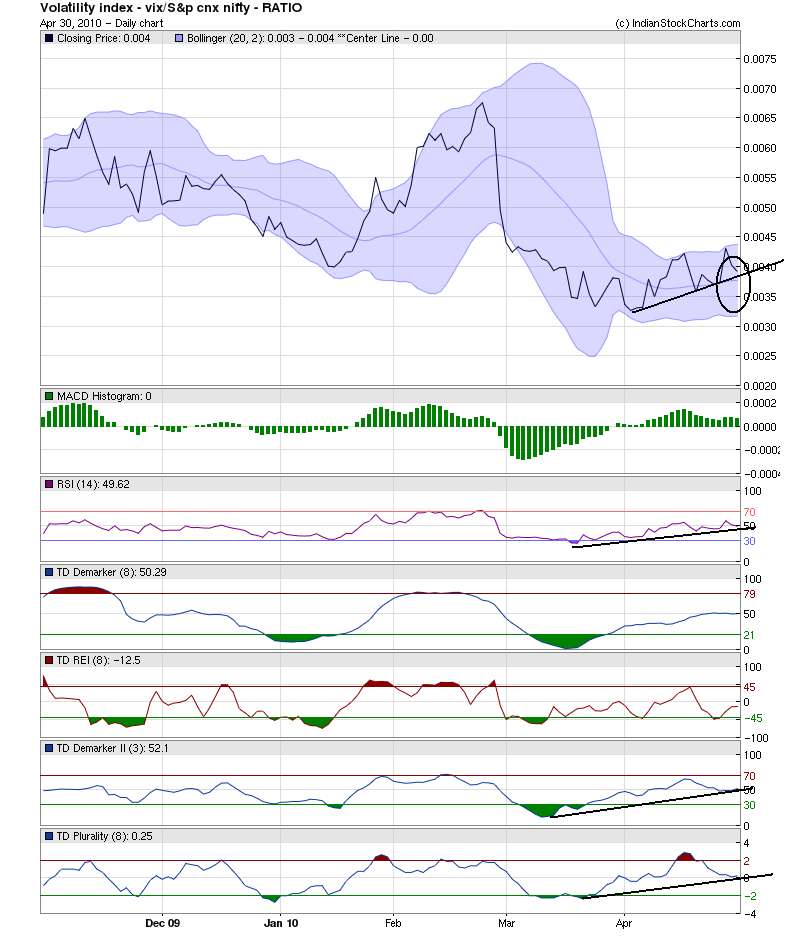
Weekly nifty chart shows clear indecisiveness, may be it was due to options expiration. We may get more clarity in the coming week(s). Chart from this week is not really that "telling" and hence it is difficult to state which direction market will head next week. The chart below is the ratio chart of Indian VIX (Volatility index) to Nifty. This chart shows the correlation between Volatility and the moves in Nifty. The lower this chart, the higher the chances for Nifty to move up and vice-versa. This chart gives more clarity to the picture. As it is clearly an inverse to Nifty direction, it is full of positive divergences upon itself. Most importantly it is still above it's BB center line. MACD Histogram is positive. Unless market moves to the upside, this chart tells us that we will have much more pain for nifty to the dowside in the coming days/weeks.
Trades for Next week
If you have already initiated a short position, trade with strict SL. Not really a good idea to go long in the coming week since there is a chance of negative divergence developing up. It is better to wait until the dust settles down and nifty clearly tells us which way it is going to go. Yes, you may loose a few points early on, but there will be lot more that you can catch with more confidence. If we are unable to break above BB center line in the coming week, one can accumulate short positions as we go forward. Have a Wonderful Trading Week ahead.
Regards
Disclaimer: At the time of this writing, neither the authors nor our team held any positions on any securities unless otherwise explicitly stated. All information above is only for educational purposes and you are responsible for your own actions.
India's No.1 Trading Community From the desk of StocksBuddy.com Analysts comes the above article. SB Analyst team comprises of experts from varied fields such as Technical Analysis, Fundamental Analysis, Macro-Micro Economics, World Affairs, Currency and much more. Apart from user contributions, our analysts post analysis on StocksBuddy.com on a regular basis. For more details, please visit us @ http://www.stocksbuddy.com/blogs
© 2010 Copyright StocksBuddy - All Rights Reserved
Disclaimer: The above is a matter of opinion provided for general information purposes only and is not intended as investment advice. Information and analysis above are derived from sources and utilising methods believed to be reliable, but we cannot accept responsibility for any losses you may incur as a result of this analysis. Individuals should consult with their personal financial advisors.
© 2005-2022 http://www.MarketOracle.co.uk - The Market Oracle is a FREE Daily Financial Markets Analysis & Forecasting online publication.