


Business Cycle Points to Stage 6 Stocks and Commodities Bear Market
Stock-Markets / Business Cycles Aug 24, 2007 - 12:09 AM GMTBy: Damian_Campbell


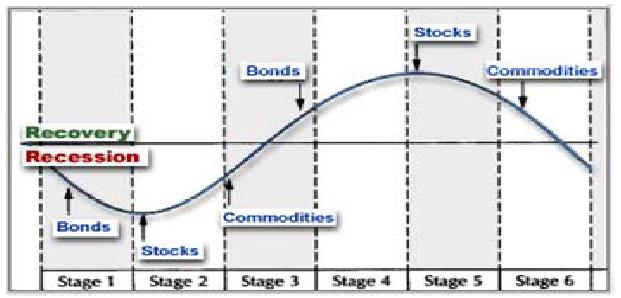
The Normal Business Cycle
As refined by Martin Pring in his book The All-Season Investor , economic and stock
cycles can be broken down into stages. The complete normal business cycle usually
lasts approximately 42 - 54 months, but this typical length can be altered by monetary
policy. Business activity goes from the despair of the depths of recession to the
euphoria of the peaks of business expansion and back again.
During this pendulum of
activity the main investment vehicles - stocks, bonds and commodities - change in
their perceived value. It is important to recognize where the pendulum of business
activity is, in which direction it is swinging and the relative value of investment
vehicles in the context of this cycle. Each of the six stages provides better risk/return
for certain asset classes over others.
We have very likely just entered Stage 6 of the Business Cycle.
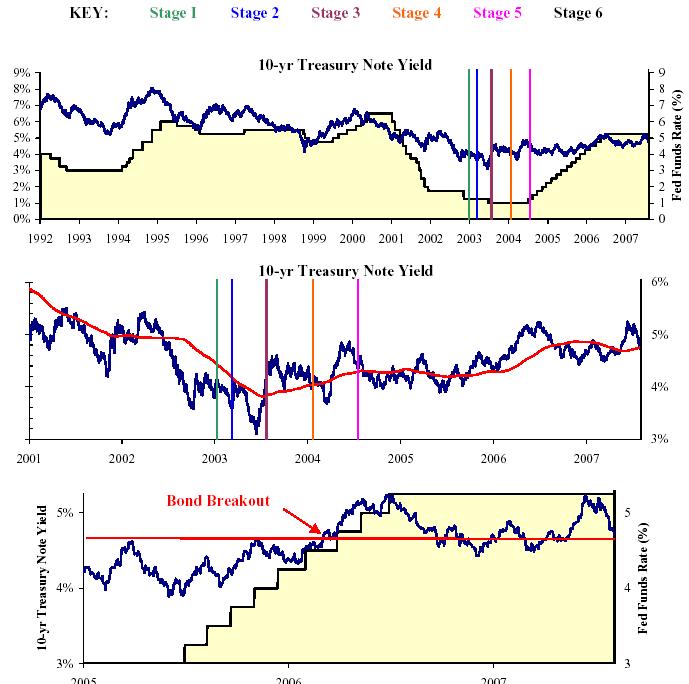
Stage 6 is a period in which business activity is in decline and entering into recession. Bonds, stocks and commodities all begin turning downward. This decline in business activity is largely a result of increased interest rates.
Rates have increased from 1 % 3 years ago, and are now at their highest level since April, 2001. In June, 2006, the US Federal Reserve raised interest rates for the 17th time in a row to 5.25 %. Other current global rates include 4 % in Europe, 5.5 % in the U.K., 8 % in New Zealand, and 0.5 % in Japan.
In a historic policy change, the Bank of Japan (BOJ) on 3/9/2006 scrapped five-year-old super-loose monetary policy and announced intentions to increase rates. A small move higher is widely expected later this month (August, 2007). Japan is the second biggest economy in the world, and their eventual move to a tightening policy will pressure the Yen and our bond yields higher. During the past decade, the yen-carry trade has underpinned the global markets. Anyone who borrowed for next to nothing in Yen and bought U.S. Treasuries received a twofold payoff: the yield difference plus the dollar's rise versus the yen. But when the Bank of Japan eventually raises rates and more investors buy into Japan's revival, the yen is sure to rise, resulting in a rapid curtailment of the yen-carry trade. Realization that this trade is moving against investors may send shockwaves through global markets.
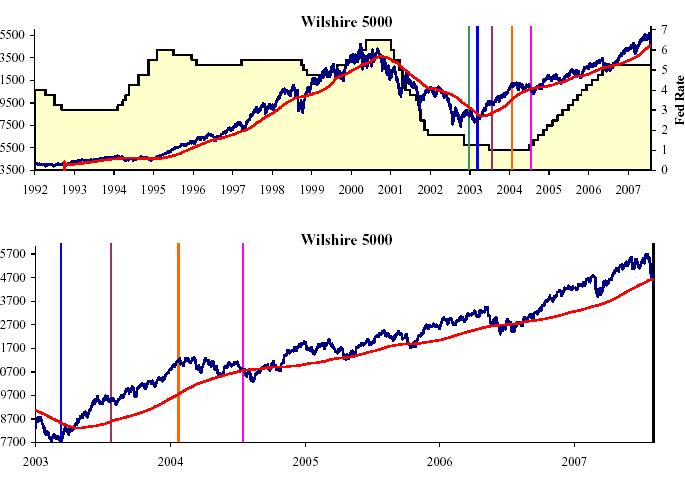
During Stage 6, stocks begin the early phase of their bear market in anticipation of declining earnings. The bearish influence of falling bond prices (higher yields) also pulls interest sensitive stocks downward.
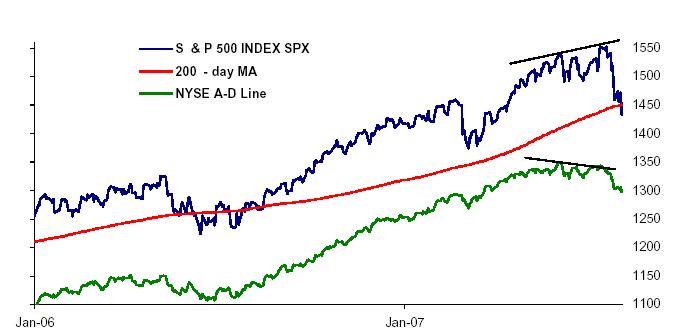
The S&P 500 and the Wilcox 5000 Indices have sharply pierced their 200-day moving averages in last week's market action. In addition, the peak of the bull market in equities is usually marked by a decrease in the number of stocks participating in the rally. The NYSE advance-decline line during the most recent market advance showed a negative divergence to equity indices that warned of an impending correction. Another early sign of a market top is underperformance by riskier small caps (Russell 2000) as money rotates to the relative safety of larger issues.
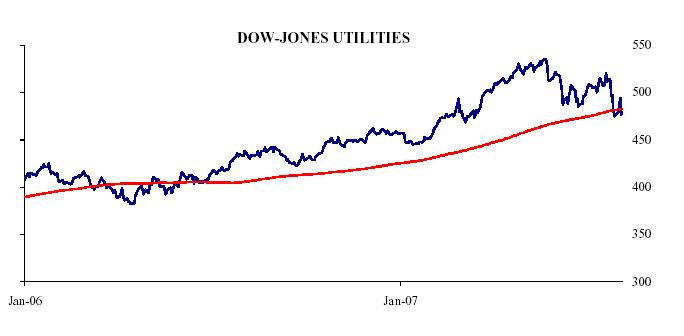
The interest-sensitive Dow Utility Average tends to lead trend changes in the broader averages. On July 27, 2007, it breached its 200-day moving average for the second time since April, 2004.
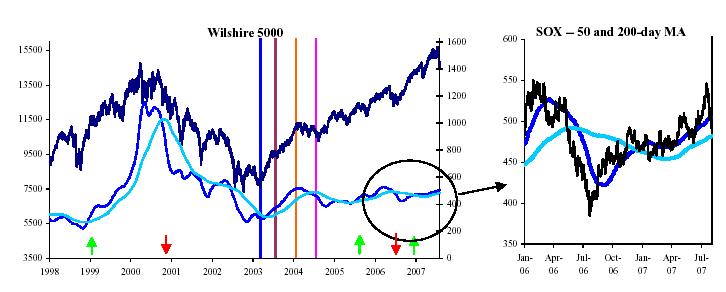
The Semiconductor Cycle is usually a good proxy for the general market’s trend in relation to the business cycle. The action of the Semiconductor Index currently argues against a significant market decline. After a period of weakness in the second half of 2006, the SOX has recovered and its 50-day and 200-day moving averages continue to trend upwards.
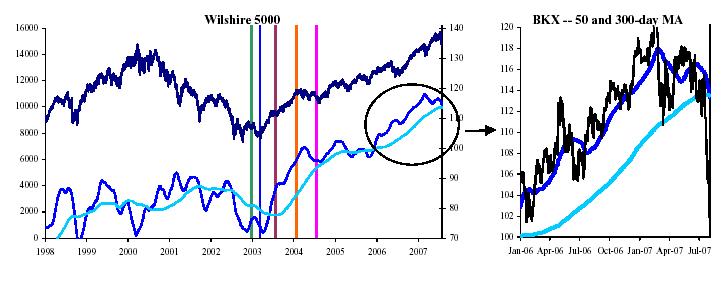
But the Financial Select Sector SPDR (BKX) paints a different picture. It tends to lead trend changes in the NYSE. The Banking Index peaked in February, 2007, but has since spiraled rapidly downward below its 50-day and 300-day moving averages.
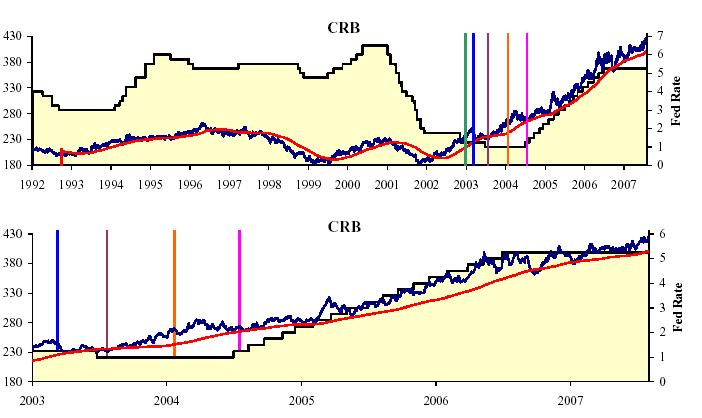
The Fed target interest rate is highly correlated with the CRB, and commodity prices have a greater than 90% correlation with three important inflation measures (PPI, CPI, GNP deflator). Commodities during Stage 6 begin their decline. A huge part of this cyclical bull market in commodities has been the Chinese economy's need for natural resources, and the US housing boom. The collapse of the US housing market will contribute to the decline in commodities.
These stage sequences are not in fixed time slots. And there also may be a reversion to an earlier stage of the business cycle. The average recession varies from nine months to two years, the expansionary phase from one to three years. The relative duration of each stage and the overlap of stages varies from business cycle to business cycle. However, in any given cycle, monitoring the three investment categories will guide us fairly accurately through the course of the business cycle.
By Damian Campbell
Investment Manager
www.cetcapital.com
Damian Campbell is President and head money manager of CET Capital, a Registered Investment Advisory firm. He oversees the testing and execution of all CET Capital investment programs. Please visit us on the web at www.cetcapital.com or call toll free 888-884-6468.
Disclaimer : CET Capital does not make any representations or warranties as to the accuracy, timeliness, suitability, completeness, or relevance of any information prepared by any unaffiliated third party, whether linked to CET Capital's Web Site or incorporated herein, and takes no responsibility therefore. All such information is provided solely for convenience purposes only and all users thereof should be guided accordingly.
Damian Campbell Archive |
© 2005-2022 http://www.MarketOracle.co.uk - The Market Oracle is a FREE Daily Financial Markets Analysis & Forecasting online publication.