Stock Market Gyrations and the “Yen Carry” Trade
Stock-Markets / Yen Carry Trade Aug 23, 2007 - 08:47 PM GMTBy: Gary_Dorsch

 For long-term buy and hold investors in the US stock market, who simply sit through wild market gyrations, it's good to know that you have “Plunge Protection Insurance.” The dynamic duo of US Treasury chief Henry Paulson and Federal Reserve chief Ben “B-52” Bernanke are working overtime these days, and using all the weapons in their arsenal to prevent a bear market from materializing, while Wall Street faces its worst financial crisis in many decades.
“I asked Chairman Bernanke if he would use all the tools available to him and he said, Absolutely,” said US Senator Christopher Dodd on Aug 21st, after a meeting with Paulson and Bernanke, the top commanders of the “Plunge Protection Team” (PPT). “Historically the federal funds rate has tended to follow movements in the discount rate,” Dodd added, alluding to the PPT's most potent weapon.
In today's world of extreme market volatility and information overload, the memory span of the average hedge fund trader has been reduced to about 24-hours. Yet just two weeks ago, the global stock markets went into a mini meltdown, after BNP Paribas, France's biggest bank, froze 2 billion euros in three hedge funds it manages, because they contained toxic US sub-prime mortgage debt that couldn't be sold.
It was the second time that the American sub-prime debt bomb exploded in Europe. Earlier, Germany's IKB Bank, said it expected to lose a fifth of its 17.5 billion euro ($24 billion) stake in US sub-prime mortgages. To stop IKB from un-raveling, the Bundesbank cobbled together several banks to provide 3.5 billion euros to cover the bank's losses, and prevented Germany's biggest banking crisis in 75 years.
In July, Bear Stearns declared that two of its hedge funds that owned toxic US sub-prime slime were headed for bankruptcy. Ahead of the next round of quarterly earnings reports in October, traders are wondering if other banks and investment firms that are exposed to billions of dollars of the toxic sub-prime mortgages, will come clean and show the full extent of their losses.
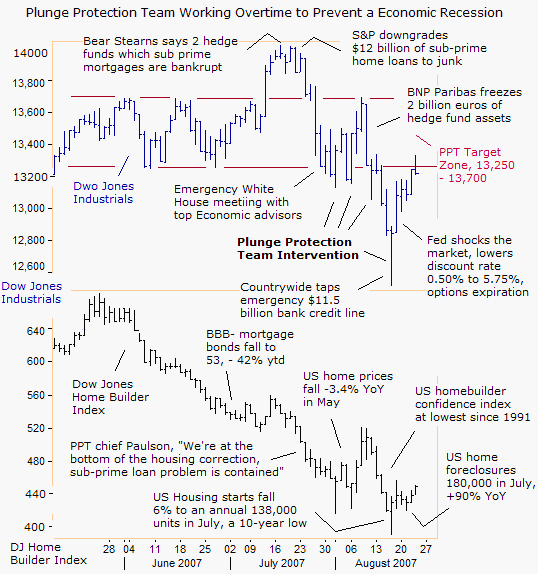
Looking at the big picture, the Dow Jones Industrials is a key instrument of national economic policy, and that by “actively managing” its direction, the US Treasury and the Federal Reserve aim to impact the wealth of tens of millions of US households, and by extension, influence consumer confidence and spending. The PPT's strategy is to offset weakness in the US housing market, with increased household wealth in the stock market, to avoid the dreaded “R” word - Recession.
The Plunge Protection Team (PPT) has several weapons in its arsenal to “influence the direction” (rigging) of the stock market. The first line of intervention is “Jawboning” or propaganda spewed to the media, designed to influence market psychology and trader behavior. For instance on July 23rd, PPT commander in chief Paulson told CNBC television, “There has been a very significant housing correction. I think we're at or near a bottom. There's a problem with sub-prime mortgages but it's quite containable. The economy is very, very healthy,” he said.
But when verbal intervention or “Jawboning” begins to wear thin, or is seen as misleading and not backed up by the facts, the PPT can turn to its next weapon, active intervention in the stock index futures markets. In July, the PPT tried to draw a line in the sand for the Dow Jones Industrials at 13,250, by purchasing stock index futures contracts after big market plunges, and squeezing short sellers.
But the shocking revelations at BNP Paribas and Germany's IKB, and reports that Citibank, the largest US bank, might own $35 billion of sub-prime home loans, overwhelmed the PPT's intervention efforts at the 13,250 defense line.
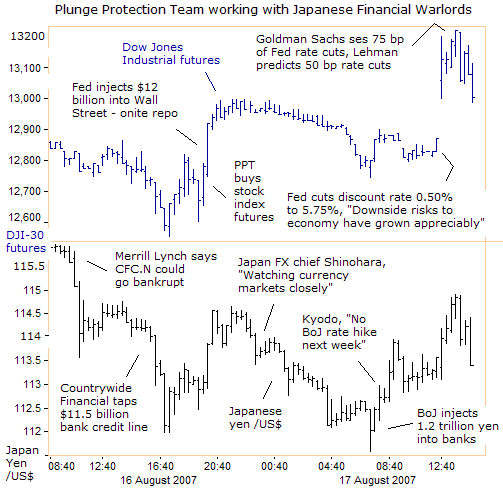
Once the PPT's defense line at 13,250 was broken, the Dow Jones Industrials fell sharply, and went into a panic free-fall on August 16th, when Countrywide Financial tapped an emergency $11.5 billion line of credit from its bankers to stave off bankruptcy. Countrywide's 5.8% notes maturing in 2012 fell 8.4 cents on the dollar to 81.6 cents, yielding 10.81%. Moody's downgraded the senior debt ratings of Countrywide Financial to Baa3, the lowest investment-grade rating, from A3.
It was looking very bleak for the S&P 500 Index on August 16th, which was teetering on its first 10% correction in 53-months. But then suddenly, the PPT began its most impressive rescue operation this year. First, the Fed injected $12 billion into the hands of Wall Street dealers in the last hour of trading, who in turn, pumped DJI-30 futures from a 330-point loss to break-even by the closing bell.
The next morning, the Plunge Protection Team unleashed its second most powerful weapon, by lowering the discount rate on loans to major banks by 0.50% to 5.75% just minutes before the expiration of put option contracts on US stock indexes.
The Dow Jones Industrial futures market vaulted sharply higher from a 120-point loss in European dealings to a stunning 257-point gain, within a five minute span, after the Fed pledged to drive interest rates as low as necessary to drive the stock market higher. “The FOMC judges that the downside risks to growth have increased appreciably, and is prepared to act as needed, to mitigate the adverse effects on the economy arising from the disruptions in financial markets,” the Fed said on Aug 17th.
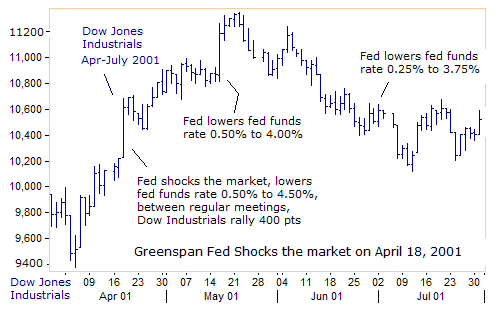
The PPT's inter-meeting move to lower the discount rate by a half-percent, coupled with a pledge to take further action to inflate the stock market, created a powerful short squeeze. It was reminiscent of the “shock therapy” applied by former Fed chief “Easy” Al Greenspan in April 2001. At that time, Greenspan shocked the markets in between regular meetings, by slashing the fed funds rate a half-percent to 4.50%, as part of his crazed effort to re-inflate the US stock market bubble, and avoid the Japanese deflation experience after the bursting of the Nikkei 1987-89 bubble.
The surprise rate cut on April 18, 2001 jettisoned the Dow Jones Industrials 400-points higher to 10,600, and was followed-up with another half-point rate cut to 4.00% a month later, juicing the DJI-30 average up 375-points to 11,200. In hindsight however, the DJI-30 was simply building a “rounding-top” pattern, and ultimately rolled over into an erratic bear market over the next 22-months.
The US Treasury – Tokyo Connection
In today's brave new world of global investing, the PPT leans heavily on Tokyo's financial warlords, to help manage the “yen carry” trade. The sharp unwinding of “yen carry” trades from July 19th thru August 16th, highlighted by the US dollar's slide from 123.50-yen to as low as 112.10-yen, contributed significantly to the downfall of the Dow Jones Industrials from the 14,000 level to as low as 12,500. It could also be argued, that the DJI-30 slide triggered unwinding of “yen carry” trades, which in turn, made the stock market plunge more violent.
Between the Fed's $12 billion repo injection last Thursday afternoon, and the discount rate cut on Friday morning, at 12:30 am EST, Japan's new FX chief, Naoyuki Shinohara, made his first public comment since taking up the job, “As always we are watching currency markers carefully.” Currency traders understand the code words “watching carefully” as a threat of intervention in the market.
At 9:14 am on Friday morning, just minutes before the opening of the NYSE, Japan's Kyodo news agency reported, without quoting sources, that the Bank of Japan would likely to hold off from raising interest rates at its policy board meeting on August 23rd. The Kyodo report lifted the US dollar by 1-yen to 114.30-yen. On Sunday night at 7:22 pm EST, Japanese Finance Minister Koji Omi told the media, “I am watching developments closely,” lifting the dollar further to 115.20-yen.
Japanese Finance Minister Koji Omi said he agreed with PPT chief Henry Paulson in a phone conversation on August 21st that the two sides would closely watch market developments for a while. “We held frank discussions on market and economic conditions. We agreed that we will watch market developments carefully for a while.” The dollar was trading at 114.80-yen when Omi spoke to the media.
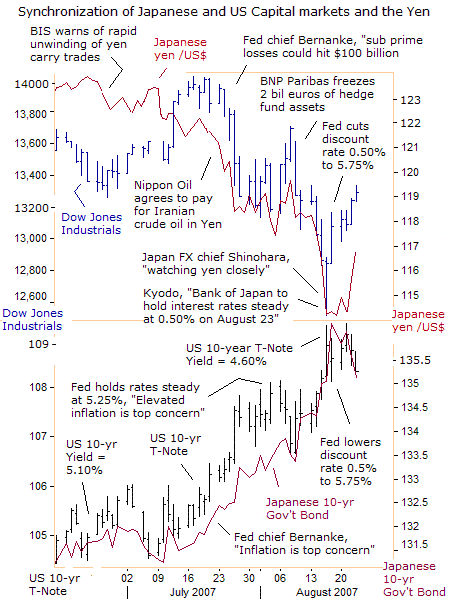
Anytime the yen does rise sharply, Japanese warlords begin talking about “unnatural moves in markets”, and warn, “We are watching the yen closely.” Having elevated “Jawboning” to an art form, outright intervention usually isn't necessary. Few traders are willing to challenge Tokyo warlords, after Japan sold a massive 35 trillion yen ($330 billion) in 2003 and Q'1 2004, to stop the dollar from falling under 100-yen.
After witnessing a 10% slide in the Morgan Stanley All-World Index since mid-July, Japanese Finance Minister Koji Omi said on August 21st, “The G-7 countries raised concerns about one-way bets in markets in February. I think the yen carry trade has been unwound.” Nobody knows the exact size of the “yen carry” trade, but estimates run anywhere from $500 billion up to $1.2 trillion.
But as long as Tokyo continues to actively manage the dollar's value against the yen, and the Bank of Japan keeps its interest rates pegged below 1%, the “yen carry” trade will continue to mushroom to dangerously high levels. The only way to put this high leveraged trading activity out of business, is for the impossible to happen, the BoJ must lift its interest rates above 1 percent!
“Global financial markets need Japan's interest rate to be returned to normal,” said Bank of Australia chief Glenn Stevens on August 17th. “It's fundamentally a distortion to have Japan's interest rates as low as they are. The sooner the Japanese interest rates are able to be normal again, the better from the point of view of the global-financial system,” he declared. However, the US Treasury and Wall Street are hooked on cheap capital from Tokyo, and love the “yen carry” trade.
Playing the Yen Carry Trade
What surprised “yen carry” traders during in the US dollar's recent slide to as low as 112-yen, was the lack of Japanese intervention at the 116-yen area, where Tokyo warlords had placed a floor under the dollar in December 2006 and again in March 2007. Tokyo might have bowed to heavy pressure from its trading partners in Asia, Canada, and Europe for a stronger yen, to level the playing field for exporters.
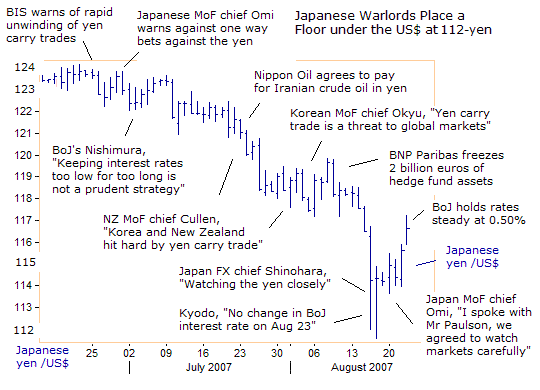
This time, with the dollar falling under the March low at 116-yen, the unwinding of the “yen-carry” trade hit the stock markets like a hurricane. Global traders, who leverage about 10 times their own cash to trade stock index futures contracts, were unwinding losing positions with the trigger of automatic stop-loss limits. The dollar quickly plummeted 4.5-yen to as low as 112.10-yen on August 16th.
South Korean Finance Minister Kwon O-kyu had said on August 14th, “Excessive carry trades for gains from interest rate differences can shake macro-economies of the countries affected, and cause as big a turmoil as the 1997 crisis, if the capital is withdrawn in a rush due to unexpected shocks. The yen-carry trade and misalignment among major currencies are not good for the global economy.”
“Despite an economic recovery and a huge current-account surplus in Japan, the yen has been weakening. There was frank and deep discussion on the issue and many ministers who attended APEC agreed with his view, Kwon said on August 3rd. “Both Korea and New Zealand have been particularly hit by the yen carry trade in recent months,” New Zealand Finance Minister Michael Cullen complained on August 2nd.
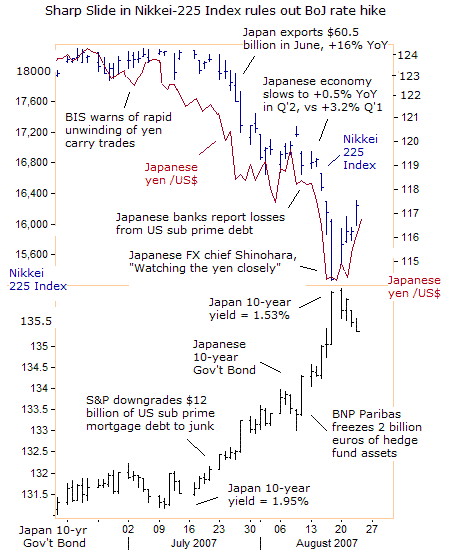
Tokyo warlords paid a very heavy price for allowing the dollar to fall below 116-yen. It triggered a second wave of selling in the Nikkei-225 Index to the 15,400-level, or 15% below the six-year high of 18,250 reached in mid-July. Banking shares led losers on uncertainties over their exposure to the US credit market turmoil. Aozora Bank said it had total exposure of 21 billion yen in US sub-prime loans and has already written down 4.48 billion yen worth.
Mizuho Financial, the second-largest Japanese banking group said it has exposure of 50 billion yen to the market.
Sumitomo Mitsui Banking, the third-largest Japanese bank said its exposure to the US mortgage market totals 100 billion yen, but is mostly in high grade assets. If the Nikkei-225 Index remains weak and underperforms other global markets, a BoJ rate hike to 0.75% could be on ice for a long time. The BoJ will take another look at the dollar /yen exchange rate and the Nikkei-225 at its September 18th meeting.
“We need to closely watch developments in international financial markets and the global economy, and tie our assessment to future monetary policy decisions. It is most important that the adjustment process will proceed in an orderly way. I think it will take some time. Re-pricing of risk will probably lead to realization of losses. The process could be painful,” BoJ chief Fukui said at his August 23rd press conference.
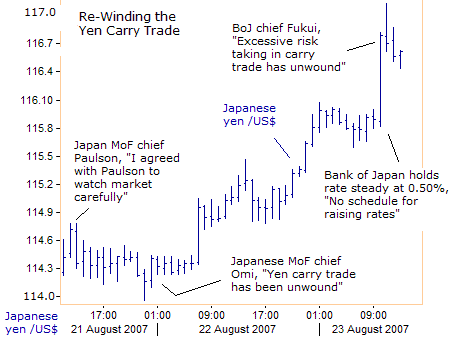
Currency traders are already jumping back into the yen carry trade, betting that the Plunge Protection Team will pressure the Bank of Japan to keep its rates steady for the remainder of the year, especially with the Fed expected to lower the US fed funds rate in the months ahead. “If the Fed were to take some kind of policy step in September, we will carefully analyze US economic and price conditions, and will closely examine whether our views match those of the Fed,” Fukui said.
“We have been saying that if market players come to think the BOJ will keep rates at a low level, that would prompt them to tilt risks excessively and create distortions in asset allocation,” Fukui said. Yet the BoJ's leak to the Kyodo news agency last week, telegraphing a steady Japanese monetary policy had already energized the Dow Jones Industrials' with its 800-point rally above the August 16th low.
PPT Expected to Unleash its Most Powerful Weapon
Now, the PPT is working hard to jig the Dow Jones Industrials back into its former trading range between 13,250 and 13,700, with its magic bag of tricks. A lower fed funds rate is probably required to keep the artificially inflated stock market afloat. The question in the Chicago interest rate futures market is whether Ben “B-52” Bernanke will lower the fed funds rate by a quarter or a half-point, perhaps at an inter-meeting rate cut before Sept 18, for extra shock treatment.
Yet how far could the Fed cut rates, given the perilous state of the US dollar? And what impact would Fed rate cuts have on the “yen carry” trade?
It's a very dramatic turn of events since the Fed's statement on August 8th, when it held the fed funds rate steady at 5.25%, and said its top concern was elevated inflation. “Financial markets have been volatile in recent weeks, credit conditions have become tighter for some households and businesses, and the housing correction is ongoing. However, a sustained moderation in inflation pressures has yet to be convincingly demonstrated. Moreover, the high level of resource utilization has the potential to sustain those pressures.”
But over the past decade, a pattern has emerged in US financial markets. Every time there has been a crisis, the Fed has opened the spigots and poured liquidity into the stock market to mute the impact on the real economy. The “Greenspan put” was a bet that “Easy” Al” would respond predictably to financial crises. His response to the bursting of the dotcom bubble in 2000-01 was to slash interest rates to less than zero percent in inflation adjusted terms for more than a year.
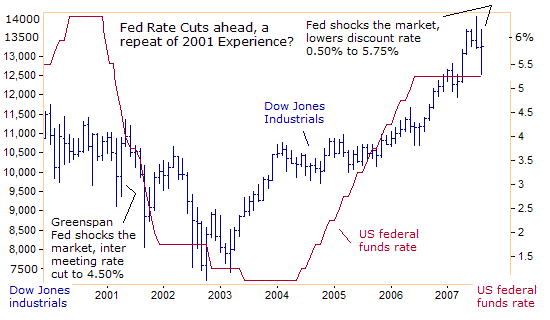
Greenspan was a serial bubble blower, and today's problems with record home foreclosures, a deflating housing bubble, incipient inflation, a crippled US dollar, and the sub-prime debt bomb are all part of the mess that Greenspan left behind. Now that B-52 Ben is signaling a lower fed funds rate ahead, some traders are wondering if an easier Fed policy could signal the death knell for the DJI-30's bull market's run since March 2003, similar to the experience of 2001-02.
On the other hand, the Plunge Protection Team has demonstrated its ability to rig the stock market in the past week. The PPT is “watching the markets closely”, and Paulson and Bernanke aim to prevent a 10% correction at all costs. There are glaring signals in the marketplace that indicate when the PPT appears to be intervening in stock index futures, and these signals were revealed in the August 3rd and August 10th editions of Global Money Trends, with plenty of cool charts.
PPT Rigging under Fire from Swiss National Bank
Swiss National Bank chief Jean Pierre Roth, sharply criticized the PPT for trying to rig the stock market in a interview with the Neue Zuercher Zeitung on August 19th. "We hope that volatility stays higher. What we had was not normal, namely, practically no volatility. Markets cannot be a one-way street, or you will get excess. The aim of central banks should not be to eliminate volatility again,” he said.
Roth said explosions from the US sub-prime mortgage debt bomb have some way to fully detonate. “We have not got to the end of the story regarding the development of mortgage markets in the United States. The origins are in cheap credit. What happened is unbelievable,” said Roth. The exposure of French and German banks to the US sub-prime slime did lead to a flight to safety into the Swiss franc from the Euro in recent weeks, tightening monetary conditions in Switzerland.
“The exchange rate and the expensive credit conditions have in fact led to a significant tightening of monetary conditions, especially in the USA, but also in Switzerland,” said Swiss National Bank deputy Philipp Hildebrand on August 21st. He said banking giants UBS and Credit Suisse were in a “comfortable position” to deal with potential shocks through their profitability and surplus capital. “They are capable of absorbing larger shocks through their balance sheet,” he said.
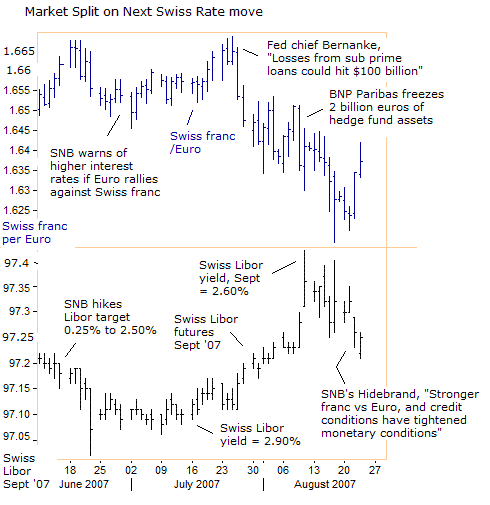
So it will be very interesting to see, if the SNB goes forward with a quarter-point rate hike to 2.75% at its upcoming Sept 13th meeting, especially with the Federal Reserve under heavy pressure to lower the fed funds rate to prop-up the US stock market. The SNB often co-ordinates its rate moves with the European Central Bank, which will decide whether to lift its repo rate by a quarter-point at the very last minute, at its upcoming September meeting.
Higher interest rates in Europe, coupled with an easier Fed policy, could knock the US dollar lower.
At the moment, Swiss franc Libor futures for September are yielding 2.75%, above the SNB's 2.50% target, suggesting that a majority of traders expect the SNB to lift its Libor target next month, despite the turmoil in the global credit markets. Much will depend upon gyrations in the Euro /Swiss franc exchange rate.
Ancient Chinese Secret
If US Treasury chief Paulson wants to know the magic elixir for elevating the Dow Jones Industrials to 20,000, perhaps he can ask his hosts in Beijing for the secret, the next time he goes on a mission, asking for a stronger yuan. Shanghai red-chips climbed above the 5,000-point level last night, passing another milestone in a spectacular bull run that has more than quadrupled the index since the start of last year. It ended last year at 2,675 points and closed the previous year at 1,161.
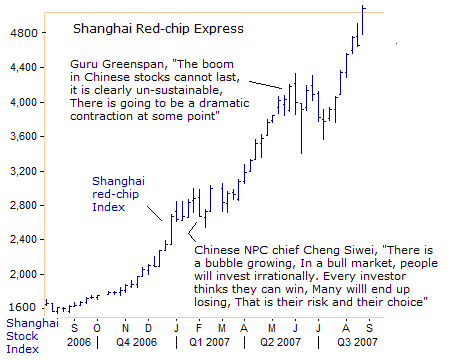
The bull-run has added a staggering $2.5 trillion to the value of the Shanghai and Shenzhen markets since the start of 2006. Three months ago, “Easy” Al Greenspan warned that the Shanghai red-chip rally was a bubble about to burst. And who knows more about bubbles than Greenspan himself? “It is clearly unsustainable. There's going to be a dramatic contraction at some point,” he said. At that time, the Shanghai index was at 4,173 points, before a brief correction to 3,600 unfolded.
China may overtake the United States to become the world's second largest exporter this year if its current export growth speed continues. In 2006, China's export volume trailed that of the US by $70 billion, while its export growth speed was 7% higher than that of the US. Calculated with the current growth rate, China's export might exceed that of the US by $50 billion this year.
Looking forward,
Is it a fundamental mistake to figure that the direction of the Dow Jones Industrials is somehow linked to the direction of the US economy? Instead, what factors should traders focus on, besides the “yen carry” trade? How would Fed rate cuts impact the stock market in the months ahead? What's the outlook for Asian, European, and Emerging stock markets, foreign currencies and gold? These questions will be addressed for paid subscribers in the August 24th edition of Global Money Trends.
The Global Money Trends newsletter provides insights and analysis on the global commodity, currency, and bond and stock markets that are not found in the mainstream media. Each edition contains lots of cool charts, and is published 44 times per year on Friday's, with special alerts when unexpected events unfold.
By Gary Dorsch,
Editor, Global Money Trends newsletter
http://www.sirchartsalot.com
This article is just the Tip of the Iceberg, of what’s available in the Global Money Trends newsletter! Here's what you will receive with a subscription, Insightful analysis and predictions for the (1) top dozen stock markets around the world, Exchange Traded Funds, and US home-builder indexes (2) Commodities such as crude oil, copper, gold, silver, the DJ Commodity Index, and gold mining and oil company indexes (3) Foreign currencies such as, the Australian dollar, British pound, Euro, Japanese yen, and Canadian dollar (4) Libor interest rates, global bond markets and central bank monetary policies, (5) Central banker "Jawboning" and Intervention techniques that move markets.
GMT filters important news and information into (1) bullet-point, easy to understand analysis, (2) featuring "Inter-Market Technical Analysis" that visually displays the dynamic inter-relationships between foreign currencies, commodities, interest rates and the stock markets from a dozen key countries around the world. Also included are (3) charts of key economic statistics of foreign countries that move markets.
A subscription to Global Money Trends is offered at only $150 US dollars per year for “44 weekly issues”, including access to all back issues. Click on the following hyperlink, to order now, http://www.sirchartsalot.com/newsletters.php Call toll free from USA to order, Sunday thru Thursday, 2 am to 4 pm EST, at 866-576-7872.
Mr Dorsch worked on the trading floor of the Chicago Mercantile Exchange for nine years as the chief Financial Futures Analyst for three clearing firms, Oppenheimer Rouse Futures Inc, GH Miller and Company, and a commodity fund at the LNS Financial Group.
As a transactional broker for Charles Schwab's Global Investment Services department, Mr Dorsch handled thousands of customer trades in 45 stock exchanges around the world, including Australia, Canada, Japan, Hong Kong, the Euro zone, London, Toronto, South Africa, Mexico, and New Zealand, and Canadian oil trusts, ADR's and Exchange Traded Funds.
He wrote a weekly newsletter from 2000 thru September 2005 called, "Foreign Currency Trends" for Charles Schwab's Global Investment department, featuring inter-market technical analysis, to understand the dynamic inter-relationships between the foreign exchange, global bond and stock markets, and key industrial commodities.
Copyright © 2005-2007 SirChartsAlot, Inc. All rights reserved.
Disclaimer: SirChartsAlot.com's analysis and insights are based upon data gathered by it from various sources believed to be reliable, complete and accurate. However, no guarantee is made by SirChartsAlot.com as to the reliability, completeness and accuracy of the data so analyzed. SirChartsAlot.com is in the business of gathering information, analyzing it and disseminating the analysis for informational and educational purposes only. SirChartsAlot.com attempts to analyze trends, not make recommendations. All statements and expressions are the opinion of SirChartsAlot.com and are not meant to be investment advice or solicitation or recommendation to establish market positions. Our opinions are subject to change without notice. SirChartsAlot.com strongly advises readers to conduct thorough research relevant to decisions and verify facts from various independent sources.
© 2005-2022 http://www.MarketOracle.co.uk - The Market Oracle is a FREE Daily Financial Markets Analysis & Forecasting online publication.


