Still Water Mining (SWC), A Compelling Palladium Investment
Commodities / Palladium Apr 28, 2010 - 03:14 AM GMTBy: Sol_Palha
 "To believe in one's dreams is to spend all of one's life asleep." ~ Chinese Proverb
In an article titled the Palladium; the stealth bull market, we explored the Palladium bull market and laid down the criteria necessary for Palladium to trade to the 800 ranges. We are going to post some of the excerpts of this article below before we take a look at Still water mining (SWC).
It broke through the 1st resistance point at 375 with relative ease and is now attempting to break past an even stronger zone of resistance. The $465-$475 ranges make up a zone of very strong resistance, and most likely it will take several attempts before palladium manages to break past this zone; once it does though it should be clear sailing to the 550-600 ranges.
The $465-$475 ranges which should have provided a zone of strong resistance, was once again taken out with ease, indicating that Palladium is in an extremely strong upward bullish phase. What is even more astounding is the fact that it has managed this in the face of a strengthening dollar; it is the only precious metal that continues to put in a series of new highs in tandem with a rising dollar.
Palladium will now need to trade past the 465-475 ranges for 12 days in a row. If it can achieve this, it will set up the base for a rally that could take it all the way to the 800-890 ranges. If we had to put a time frame on this, we would say that once it trades past the 465-475 ranges for the suggested period of time, it could hit these targets within 12-18 months.
It has managed to trade past the $465-475 ranges for more than 12 days in a row, laying the ground work for a move to the $800-$890 ranges. If Palladium maintains this momentum it could end up striking these targets a lot faster than we originally projected; potentially, it could hit these targets before the year is over.
We have two palladium producers in North America, PAL and SWC, but SWC has a much stronger pattern and so our focus for now will be on this chap.
SWC has had a tremendous run in the past 52 weeks and those who opened up positions early in the game and held onto them are now sitting on decent gains. As we do not like to chase a trend (we like to get in before the crowd jumps in) we are going to offer our long term and short to intermediate term views on this Stock.
Long term view

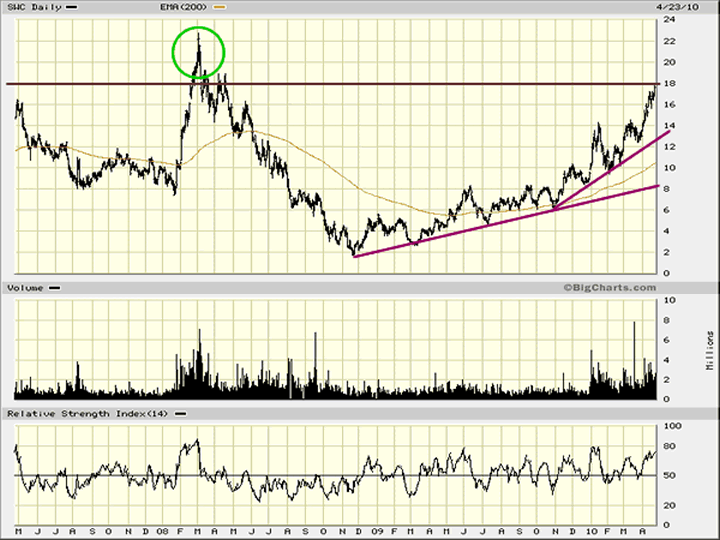
If SWC can close above $18 on a weekly basis, the odds of it testing its 3 year highs will be rather strong. We would not be surprised if after testing the $23.00-$24.00 ranges SWC experienced a small bout of profit taking. If during this round of profit taking SWC manages to stay above $12, then the next leg up should lead to a test of $30.
The main leg of the battle would begin in $34-$36 ranges; if SWC can close above this level twice on a weekly basis (in other words remain above this level for 2 weekly closes in a row) or trades above this mark for 9 days in a row, the next target will fall in the $48-$51 ranges.
A true bull market does not begin until its all time high is taken out; for SWC this would mean trading past the intra day high of 50.81 and above the closing high of 46.625. Once in the true bull phase, SWC should be able to at least double in price before putting in a long term top; this would equate to a target of roughly $100-$120.
Short to intermediate term outlook

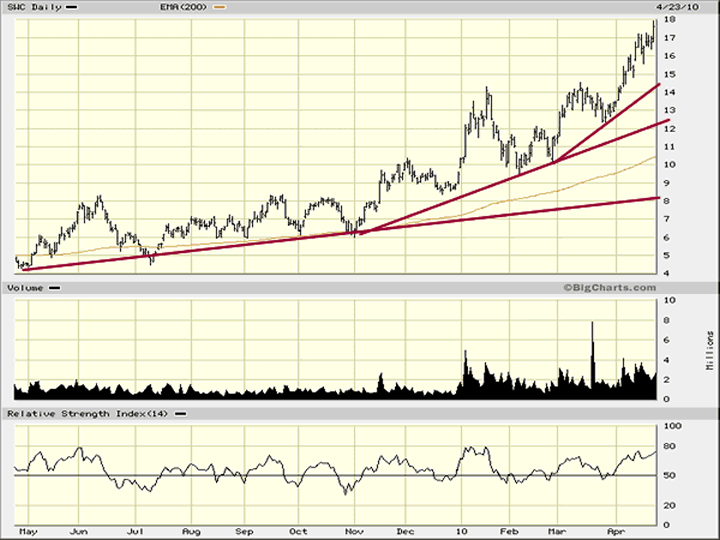
The above chart clearly illustrates that SWC has had a stellar run in the past 12 months; from low to high it has risen over 150%. Thus it would be normal to expect a bout of profit taking to take hold anytime. As long as it does not close below $12 on a weekly basis, the short to intermediate term outlook will remain bullish and a break past $18.00 for 3 days in a row could result in SWC trading to a new 3 year high. In the short term, we would be slightly cautious on how much new money we deployed into SWC as it would be best to wait for a pullback before committing new funds.
Some stats on SWC
Forward P.E. of 11.91
Average sales growth for the past 5 years has been 25%
Total cash on hand 201 million
Total debt 195 million
% of shares held by insiders is a very healthy 52%
% of shares held by institutional and mutual owners is 35% and this accounts for 72% of the float.
Additional factors that support a bullish outlook for Palladium
Worldwide sources of Palladium are rather limited. Over 80% of the world's Palladium is concentrated in just two countries, Russia and South Africa, with Russia's accounting for nearly half of the total Palladium supply. Russia has 3 sources of Palladium, the Norilsk Nickel mine, Gokhran and the Russian Central bank. Norilsk mines are the main source of palladium in Russia and production peaked back in the late eighties and output started to fall from the 90's, primarily due to lack of investment. Once prices started to rise in the 90's Norilsk started to invest more money into production and supplies of PGM's started to rise. However, production has started to fall again and to meet these supply short falls the Russian government has been selling Palladium from its stockpiles. This programme has now come to an end and with it roughly 125,000 pounds of Palladium will suddenly vanish from the supply chain. This is going shock the system (the shock process might already be underway) for taking out such a huge amount of Palladium of the market just when demand is rising is the perfect recipe to precipitate a run on Palladium as companies start to hoard supplies for fear of not having enough of the metal on hand. This could perhaps explain why Palladium is the only precious metal to put in a series of new highs in the face of a rising dollar.
Note that world Palladium supplies fell by 1% in 2009 to 6.31 million ounces despite a 5% increase in South African output to 2.48 million ounces. This increase was off set by a drop in Canadian production due to the closure of the Lac des Lles mines at the end of 2008.
Finally let's not forget the massive amount of interest the New Palladium and Platinum ETF's are creating. These two ETF's are gobbling up huge amounts of Platinum and palladium. As of March 2010, PALL holds roughly 520,000 ounces of Palladium; this ETF is barley 4 months old and its Palladium holdings have already surged past the 500,000 ounce mark. It took the London based Palladium ETF over 2 years to accumulate the same amount.
Now add in the lower supplies, increased demand due to the Palladium ETF, voracious increase by the Chinese for Palladium and the eventual hoarding of this metal by the automotive sector when they realise that they could be facing a shortage, all go to ensure that Palladium has a long way to go before a long term top is in place. Our suggestion is use strong pull backs to add to your positions in both SWC and Palladium bullion whenever the opportunity presents itself.
Conclusion
The long term outlook for SWC is extremely bullish. The current pattern is projecting a high probability that its all time high will be taken out; the if factor has been removed and has been replaced with the when factor. In between one should expect a lot of volatility; remember that good things never come about easily; if they do they were not worth it to begin with. Unlike Palladium bullion, there are two factors that come into play for SWC. One is the price of bullion and the second is the overall health of the equity's markets. If the markets are experiencing a strong correction then SWC might not move up as fast as it normally would, even if Palladium prices are rising. Therefore, it would be wise to have a position in both Palladium bullion and SWC.
Our long term targets for SWC now fall in the $100-$120 ranges. This could one day be viewed as a conservative target; once the real bull phase of a rally begins it's not unusual for a stock to at least double in price. A real bull market begins when the all time high is taken out; in this case, it would be $46.625. From a long term perspective SWC has just begun its bullish run.
"Do not use a hatchet to remove a fly from your friend's forehead." ~ Chinese Proverb
by Sol Palha
Sol Palha is a market analyst and educator who uses Mass Psychology, Technical Analysis and Esoteric Cycles to keep you on the right side of the market. He and his partners are on the web at www.tacticalinvestor.com.
© 2010 Copyright Sol Palha - All Rights Reserved
Disclaimer: The above is a matter of opinion provided for general information purposes only and is not intended as investment advice. Information and analysis above are derived from sources and utilising methods believed to be reliable, but we cannot accept responsibility for any losses you may incur as a result of this analysis. Individuals should consult with their personal financial advisors.
© 2005-2022 http://www.MarketOracle.co.uk - The Market Oracle is a FREE Daily Financial Markets Analysis & Forecasting online publication.


