


No End In Sight For Stocks Bull Market
Stock-Markets / Stocks Bull Market Apr 26, 2010 - 08:06 AM GMTBy: Michael_Swanson

 Before getting to the daily trends and what is likely now to unfold over the next few weeks I think it is important to point out to you that the longer term trend (one year plus+) for the stock market is strengthening. In fact there is no end in sight for this bull market.
Yes sentiment is getting frothy right now. The Investors Intelligence Survey is at an extreme level of the type seen this past January when the market made a temporary peak and in October 2007 at the very end of the last bull market, however you need more than extreme sentiment readings to call for the end of a bull market or the start of one for that matter.
Throughout 2008 there were more bears and bulls in this survey and the market continued lower anyway and in 2003 there were a huge number of bulls over the bears in this survey too and the market went up for four more years. This survey is useful at times, but it isn't enough to make major calls on the stock market. It's more of a confirmation tool.
The VIX is also another popular indicator that people look at to gauge sentiment, but I've found it to be fairly useless to use in picking tops. It's more useful in picking bottoms, because the VIX is great at telling us there is panic in the market that tends to coincide with market bottoms.
The put/call ratio is showing a huge number of people buying calls over puts, but it's more of a short-term indicator.
In the end there are two things most useful in telling what type of market you are in. The first is the relationship of the market averages to their 200-day moving averages - what I call module two of the Stock Market Mastery Course. The second is market breadth, which people tend to measure using the advance/decline line.
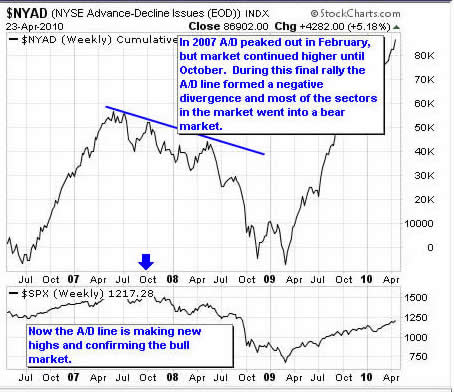
What people look for are divergences between the A/D line and the market averages to flash a warning sign that an end to a bull market may be near. In November and December we saw a slight divergence, which led to a quick correction into February, but since then the advance/decline has been making new highs along with the market, thereby telling us that this is a broad based rally.
In the Fall of 2007 one of the reasons we knew that the bull market was probably over, was because the advance/decline line had been diverging from the market averages for almost the whole year. At the peak in October most stocks and sectors were already in bear markets of their own when analyzed using stage analysis and looking at their 200-day moving averages What happened is when the market made its final high that move was driven by less than half a dozen tech stocks that were overweighting the market averages.
Incredibly almost half of the sectors were below their 200-day moving averages at the time of the October 2007 stock market peak, with many of them WELL below them and in vicious bear markets. Mortgage, construction, and real estate stocks for instance had been falling for over a year and a half almost straight down as the market made its final 2007 top.
I tell you all of this, because right now if you look beyond the market averages and the sectors themselves you will see incredible strength. I use TC2000 to analyze the stock market and it breaks the stock market up into 239 sectors. Out of those 239 sectors I cannot find a single one that is in a bear market. Not one!
There are only 4 sectors out of these 239 sectors that are even below their 200-day moving averages. They are long distance carriers, foreign utilities, telecom services, and farm products. And these four sectors are simply going sideways in a stage one base and look like they could just break out and go into bull markets over their own.
This is why I say there is no end in sight to the bull market.
I'm not saying it is going to go up forever and isn't going to have set backs.
What I'm saying is that if you are a bear there is no sign of light at the end of the bull tunnel when you look at the longer-term picture - I'm talking a year out - for the stock market.
Yes eventually we will have another bear market. But before that happens we will need to see dozens of sectors go below their 200-day moving averages and fall into bear markets of their own first. Assuming this process was to start today it would take a year for it to get advanced enough for us to worry about a new bear market starting for the major market averages and the entire stock market.
Forget about the Elliot Wave people who cite some magic numbers where they say the market MUST top out. One got a lot of TV time calling for a crash last October and was wrong. Forget about people's opinions about the economy, the deficit, and future problems that may hit us. The fact is this is a powerful bull market. Maybe those things will become problems later, but they are not problems now.
It looks to me like the stock market is going to go on for at least another year. Probably two years. And it will probably end with the market averages getting close to their 2007 highs. After that we'd probably see another big bear market break out, but that's just guessing. It's predicting. All we can know for sure is what the current trend of the market is and invest accordingly until we see that trend change. That's how you make money - not by guessing what is going to happen or holding to rigid assumptions - but by recognizing what is really happening right now.
And with the strength of the market now and the sectors inside it that would take at least a year to happen.
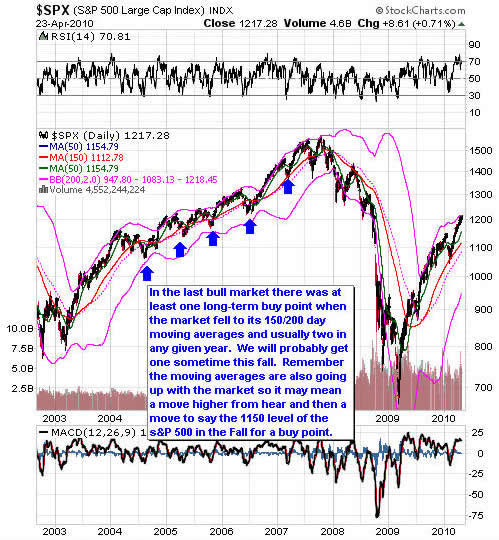
Now the market is tough to buy into right now as a long-term investor. I advocate taking positions as an investor on pullbacks to the 50, 150 and 200-day moving averages on corrections within bull markets.
As we approached this April earnings season I was telling you that the market was very overbought and it made no sense to buy into it. In fact I warned you that almost every time the market rallied into earnings season it has a pullback. I was expecting and hoping that we would see a pullback begin that would take the market down to at least its 50-day moving average.
At some point this year I expect we'll see the market fall to its 150 and 200-moving averages to bring a great buy point for an investor in which they'd be able to safely buy and hold through the rest of this year and well into next year. That probably won't happen though until the August-October time frame.
The reason why is that instead of peaking and going into a correction during this earnings season the market has simply paused and consolidated to work off its overbought condition. Then on Friday it closed at a new high for the year. That means that for now the market is about to start another leg up. I have no idea if that will last for a few days or a few weeks, but it makes it so that it isn't likely for the market to start to drop right at this moment.
I wrote an article a few days ago asking what would happen if the market didn't start a correction to its 50-day moving average right now as I was expecting. What might it do instead? I put this chart up in this article:
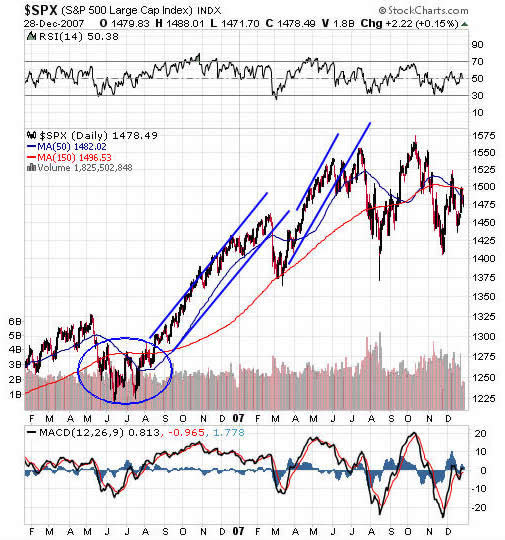
In 2006 the market went just about straight up between August and February of 2007. During this time it had a few quick and sudden pullbacks that were very shallow in nature and would only last a few days. We saw some similar type of trading in the summer and Fall of last year too. Then finally in February the market dipped back down to its longer-term moving averages and then began one final rally.
The key is that Fall rally in 2006. If the market doesn't suddenly top out now it appears that we are going to see the market just continue higher in a similar fashion now - until it finally peaks out and corrects to its longer-term moving averages.
The implications of this are clear - we will eventually get a good long-term buy point when the market comes back down to its longer-term moving averages sometime later this year. Until then though it is likely to continue higher. If you don't buy into the rally and wait for a correction than you will have a much safer entry point. You'll be able to buy and risk about nothing. But if you wait you may miss out on further market gains for the next few months. Unfortunately there is no way to know when the next pullback is going to occur. It could start tomorrow or a few months from now.
Until we get such a long-term buy point I do not fell comfortable buying a huge basket of stocks myself or recommending them as a means of timing the market or buying just because the market is going up, because I prefer buying after market corrections.
However, money still can be made in some select issues as long as one uses stops to protect oneself in case a 10-15% correction in the broad market starts. What I plan on doing is searching for select stocks....[This article is an excerpt of a WSW Power Investor Premium article, which continues with a discussion of individual stocks that look like good buys and a video discussion of the market to compliment this article. If you are a premium member to access the full article go here.
By Michael Swanson
WallStreetWindow.com
Mike Swanson is the founder and chief editor of WallStreetWindow. He began investing and trading in 1997 and achieved a return in excess of 800% from 1997 to 2001. In 2002 he won second place in the 2002 Robbins Trading Contest and ran a hedge fund from 2003 to 2006 that generated a return of over 78% for its investors during that time frame. In 2005 out of 3,621 hedge funds tracked by HedgeFund.Net only 35 other funds had a better return that year. Mike holds a Masters Degree in history from the University of Virginia and has a knowledge of the history and political economy of the United States and the world financial markets. Besides writing about financial matters he is also working on a history of the state of Virginia. To subscribe to his free stock market newsletter click here .
Copyright © 2009 Michael Swanson - All Rights Reserved.
Disclaimer - WallStreetWindow.com is owned by Timingwallstreet, Inc of which Michael Swanson is President and sole shareholder. Both Swanson and employees and associates of Timingwallstreet, Inc. may have a position in securities which are mentioned on any of the websites or commentaries published by TimingWallStreet or any of its services and may sell or close such positions at any moment and without warning. Under no circumstances should the information received from TimingWallStreet represent a recommendation to buy, sell, or hold any security. TimingWallStreet contains the opinions of Swanson and and other financial writers and commentators. Neither Swanson, nor TimingWallstreet, Inc. provide individual investment advice and will not advise you personally concerning the nature, potential, value, or of any particular stock or investment strategy. To the extent that any of the information contained on any TimingWallStreet publications may be deemed investment advice, such information is impersonal and not tailored to the investment needs of any specific person. Past results of TimingWallStreet, Michael Swanson or other financial authors are not necessarily indicative of future performance.
TimingWallStreet does not represent the accuracy nor does it warranty the accuracy, completeness or timeliness of the statements published on its web sites, its email alerts, podcats, or other media. The information provided should therefore be used as a basis for continued, independent research into a security referenced on TimingWallStreet so that the reader forms his or her own opinion regarding any investment in a security published on any TimingWallStreet of media outlets or services. The reader therefore agrees that he or she alone bears complete responsibility for their own investment research and decisions. We are not and do not represent ourselves to be a registered investment adviser or advisory firm or company. You should consult a qualified financial advisor or stock broker before making any investment decision and to help you evaluate any information you may receive from TimingWallstreet.
Consequently, the reader understands and agrees that by using any of TimingWallStreet services, either directly or indirectly, TimingWallStreet, Inc. shall not be liable to anyone for any loss, injury or damage resulting from the use of or information attained from TimingWallStreet.
Michael Swanson Archive |
© 2005-2022 http://www.MarketOracle.co.uk - The Market Oracle is a FREE Daily Financial Markets Analysis & Forecasting online publication.